Property & CasualtyMarket Update
Q2 2026
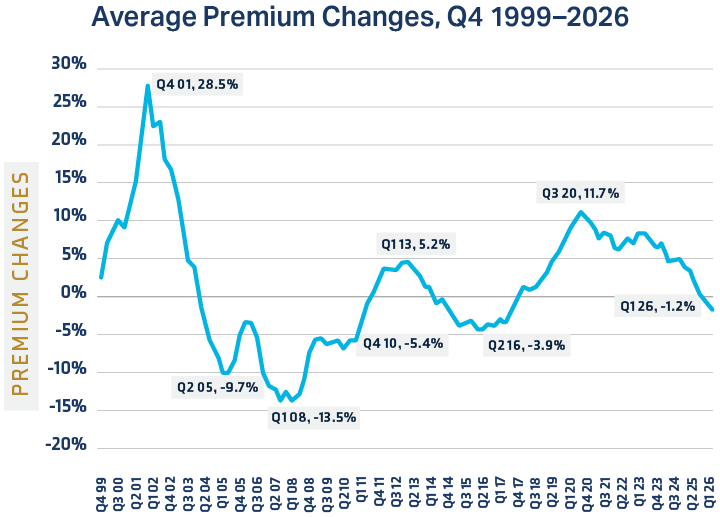
After more than eight years of rising commercial insurance premiums, the property and casualty (P&C) market entered a new phase. Average premiums across commercial P&C accounts declined in the first quarter of 2026 for the first time in nearly nine years, ending a 33‑quarter streak of increases. The shift is meaningful, but it is not uniform across the market.
Average commercial P&C premiums declined 1.2% in Q1 2026, the first overall decrease since Q3 2017.
The reversal did not happen all at once. Rate increases had been moderating for more than a year. What changed was the breadth of the move. Most lines posted decreases, with the steepest relief in commercial property, workers’ compensation, cyber, and directors and officers (D&O) liability. Carriers expanded their appetite, loosened terms, and competed for accounts they had declined a year earlier.
But the market is not softening evenly. The divide between property and casualty is the defining feature of 2026. Commercial auto extended its 59‑quarter streak of increases, while umbrella and general liability continued to rise. Lines tied to bodily injury, litigation, claims severity, social inflation, and jury verdicts remain structurally challenging, with fraud and claim manipulation adding another layer of pressure.
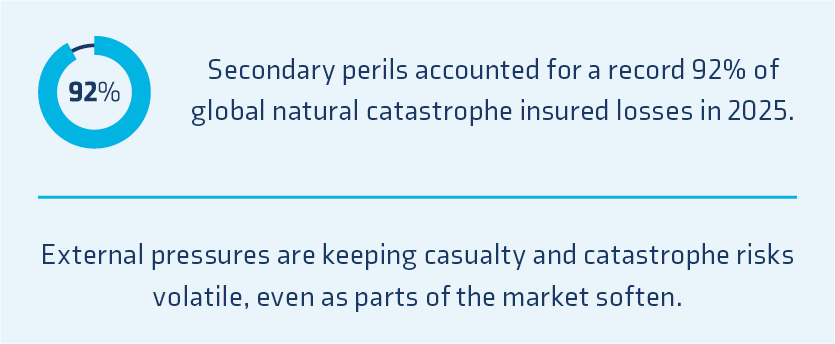
Whether this current cycle holds through the second half of 2026 depends on several factors. With abundant capital and reserves, carriers remain profitable in aggregate, supporting continued easing in property and select professional lines. Still, the tone of the market could change quickly with a major catastrophe event, an active wildfire or severe convective storm season, or renewed pressure from global instability. Secondary perils, including severe storms, hail, wildfire, and inland flooding, remain important drivers of catastrophe losses. The early stages of a soft cycle are historically when carriers tend to underprice the next round of losses.
AI exposure is also moving from emerging risk to active underwriting concern. Claims tied to deepfake‑enabled fraud, AI‑generated phishing, algorithmic hiring, governance failures, and AI‑related disclosures are beginning to flow into existing cyber, D&O, EPL, and professional liability policies. As carriers refine exclusions and underwriting questions, insureds with clear AI governance, strong controls, and well‑documented risk management practices will be better positioned at renewal.
The next couple of renewal cycles offer the most opportune buying conditions the market has seen in nearly a decade, especially for property, professional lines, and cyber. The window is real, but its duration is uncertain. Buyers that use this moment to strengthen submissions, improve risk data, and tell a credible risk management story will be best positioned to capture savings while protecting against volatility ahead.
The defining feature of the 2026 P&C market is the split between property on one side and liability and casualty lines on the other. The first quarter saw average premiums across all account sizes falling 1.2%, with nine lines posting decreases and only commercial auto, umbrella, and general liability continuing to climb. Large accounts saw the steepest declines, averaging ‑2.7%. Medium accounts fell 1.9%. Small accounts rose 1.1%, down sharply from 2.8% in Q4 2025.1
Capital investment and favorable conditions are driving this property cycle. Global reinsurance capital exceeded $700 billion entering 2026, the highest figure on record, and catastrophe bond issuance hit an all‑time high with more than $58 billion outstanding by year‑end 2025.3 Insured catastrophe losses for 2025 came in around $107 billion globally, well below the $200 billion projected, and the U.S. saw no major hurricane landfalls.4 This combination produced a year of strong property underwriting profitability while capital accumulated over the past few years is now competing aggressively for business. The London market and Bermuda casualty market, both significant influences on U.S. pricing, are following the same trajectory, with new capacity entering and reinsurance support pushing primary rates lower.
There are casualty lines experiencing a different and more challenging market, where carriers cannot price their way out of losses without continued rate increases. Nuclear verdicts continue to be a major issue. In 2024, there were a total of 135 nuclear verdicts, a 52% increase over 2023, with awards exceeding $31 billion.5 Liability claim costs grew roughly 57% over the past decade, largely due to social inflation.6
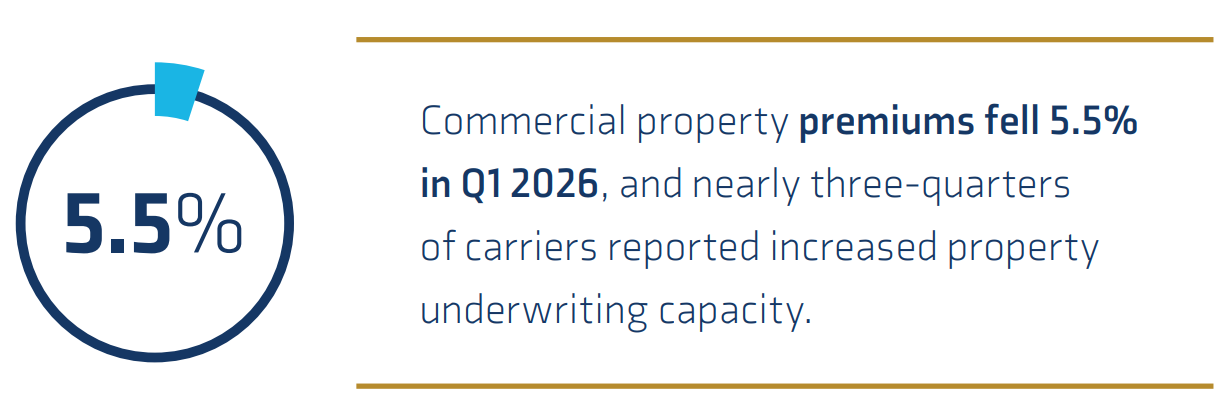
Commercial property led the decline in Q1 2026, with average premiums falling 5.5%, a sharp drop from ‑0.7% seen in Q4 2025. Nearly three‑quarters of carriers reported an increase in property underwriting capacity. Despite the early 2025 California wildfires and severe convective storm activity throughout the year, the annual loss ratio for commercial property improved to 85% at year‑end 2025, from 87.9% the year before.7
Catastrophe‑exposed accounts in Florida, California, and Gulf Coast markets are still priced firmly but are seeing improved terms and lower deductibles than a year ago. The mid‑year reinsurance renewals in June and July will be the next pressure test, and a significant hurricane landfall could affect rates.
Commercial auto remains the most challenging line in the market. Premiums rose 5.8% in Q1 2026, the 59th consecutive quarter of increases. Loss ratios have run above 100% every year since 2014, with the exception of 2021, and net underwriting losses exceeded $5 billion in both 2023 and 2024.8
Nuclear verdicts and rising medical costs remain significant contributors to losses in this line, along with increasing repair costs driven by advanced technology in fleet vehicles. Fleets with strong safety programs and clean loss histories may see better terms, but no fleet is escaping rate pressure entirely. Fleets are realizing benefits from the use of telematic video technology.
Within months of implementing this technology, some fleets have shown double‑digit improvements in driving behaviors, sharp reductions in collision risk, and measurable enhancements in overall safety scores. These changes materially improve loss experience and can shift how underwriters view an account over time.
Commercial auto remains the market’s problem line, where better safety data can help, but cannot fully offset severity pressure.
General liability rose 2.6% and umbrella rose 4.8% in Q1 2026.9 The pressure is concentrated in industries with public‑facing operations, large fleets, and exposure to high‑verdict jurisdictions.
General Liability rose 2.6% and Umbrella
rose 4.8% in Q1 2026.
For umbrella programs, the structural problem is capacity at higher layers. Carriers willing to put up $25 million or more in a single layer have grown scarce, and most first‑layer umbrella towers now cap at $5 to $10 million. Buyers needing higher limits will need to continue layering multiple insurers and pulling in excess and surplus capacity to complete their towers.
Professional and management liability lines continue to operate in a soft market, but recent indicators suggest that conditions may be shifting. Employment practices liability declined 1.8%, reflecting continued competitive conditions across professional lines, while D&O pricing fell 2.1% in Q1 2026, marking the line’s eighth consecutive quarter of decreases.10 Capacity remains abundant, particularly in the excess layers, allowing buyers to expand limits or restructure towers.
However, this line is experiencing emerging pressures, with loss severity rising due to larger settlements and an increasingly complex claims environment tied to tech exposures and geopolitical volatility. Carriers are increasing underwriting conditions, placing greater emphasis on financial stability and governance practices. These dynamics indicate this market may be nearing a turning point where underwriting caution increases and the floor for pricing is elevated.
While cyber risk is increasing, insurance conditions remain favorable, with rates decreasing an average of 3.5% in Q1.11 Threat activity is intensifying, with attacks becoming faster, more automated, and increasingly focused on identity‑based vulnerabilities such as compromised credentials and access misuse.12 Ransomware, business email compromise, and third‑party incidents continue to drive losses, underscoring the expanding threat surface as organizations adopt more cloud‑based and interconnected technologies.
Cyber premiums declined an average of 3.5% in Q1 2026.
At the same time, ongoing competition among cyber insurers and meaningful improvements in cybersecurity controls by insureds are helping to sustain favorable market conditions. Carriers are showing greater willingness to deploy limits and broaden coverage for organizations that can demonstrate mature risk management practices, including multi‑factor authentication, endpoint detection and response, and robust incident response planning. As a result, insurance remains plentiful and pricing is attractive, particularly for companies that are actively managing their cyber risk profile and can clearly articulate their controls during underwriting.
Workers’ compensation continues to defy the broader bifurcation, but underlying trends indicate the line could be entering a new phase. Into 2026, workers’ compensation remains profitable and affordable, with rates down 3.7% in Q1 and claim frequency continuing to decline.13 Yet, there is less resiliency in the line, impacted by rising claims severity, flat premiums, and increasing variability across industries and states. Even with a combined ratio under 100% for the 12th consecutive year in 2025, the trend for this line shows the ratio is compressing, especially from an accident‑year perspective. California first showed signs of change in the line, and now state mix and industry mix are becoming more material to combined ratio performance. The environment is becoming less forgiving and disciplined execution will matter more than ever.
The changing market is impacting carriers’ underwriting approach, and clients are seeing the effects across capacity, limits, and terms and conditions.
Capacity has expanded materially across most lines, particularly with property. This increase also shows in casualty and professional lines, though more selectively. Carriers that pulled back from certain industries, geographies, or risk profiles during the hard market are re‑engaging. Accounts that may have received one quote in 2023 now receive several in 2026. New entrants are competing alongside established carriers, particularly in property and cyber, tipping the industry towards a buyers’ market for the first time in nearly a decade.
The soft market favors prepared buyers, not
passive ones.
Terms and conditions are loosening alongside pricing. Property buyers are seeing broader coverage definitions, higher sublimits, and lower deductibles than they could secure a year ago. Catastrophe deductibles have come down from the post‑2023 highs, especially for accounts with strong loss histories. On the casualty side, the picture is mixed. D&O and EPL buyers are gaining ground on terms, but commercial auto and umbrella carriers continue to hold the line on attachment points, sublimits, and exclusions. Exclusions for emerging exposures, including PFAS, biometric data, and cyber‑related risks, are becoming standard across most casualty programs.
Carriers are also relying on improved data trends and AI technologies to inform underwriting decisions, looking to improve risk selection, refine pricing, and accelerate claims handling. The practical effect is that the quality of submission data matters more than it used to. Carriers are looking at richer datasets, including telematics for fleets, security posture scores for cyber, and loss control documentation for property. Buyers who present clean, well‑documented submissions are being rewarded with better terms. The soft market is real, but it favors the prepared. Clients who treat the renewal cycle as an opportunity to upgrade their data and risk management story will capture more of the available savings than clients who simply expect the market to come to them.
Several external forces are also shaping the casualty and property markets over the last quarter. Three are worth watching closely:
Severity continues to outpace frequency across most casualty lines. Claim counts in commercial auto and general liability have been relatively stable, but the average cost per claim continues to rise due to medical inflation, repair cost inflation, and litigation‑driven settlement values. Even before reaching a jury, bodily injury claims awards are now multiples of what comparable claims settled for five years ago. Carriers are holding reserves more aggressively and pricing new business with the assumption that severity will keep building.
Liability claim costs have grown roughly 57% over the past decade.
An expansion of plaintiff liability theories by courts in several jurisdictions has allowed claims to proceed under theories that would not have survived a motion to dismiss a decade ago. Coverage disputes are growing more complex as plaintiffs and policyholders test the boundaries of existing policy language, particularly around bodily injury, abuse and molestation, and AI‑related exposures. Carriers are responding by tightening policy wording at renewal, but the existing book of business already in force is exposed to claims under broader interpretations than the policies were originally priced to cover.
Claims pressure is no longer just about
frequency. Severity, broader liability theories,
and fraud are changing how carriers reserve
and price risk.
Fraud and claim manipulation are growing problems. Staged auto losses and AI‑generated documentation are becoming more common, and the National Insurance Crime Bureau has flagged contractor fraud as an escalating concern.17 Carriers are responding with updated claims technology, including AI‑driven fraud detection, to keep pace. Underwriters are looking for strong claims hygiene, including prompt reporting, thorough documentation, and active engagement with the carrier on significant claims.
AI risk has moved from theoretical to active over the past 18 months. The risks span coverage lines and concern both attacks against organizations and issues with AI use by organizations.
Most carriers have yet to build dedicated AI coverage products, so AI‑related losses are flowing into existing cyber, D&O, EPL, and professional liability policies. The current ambiguity means that sometimes claims are covered, sometimes they are not. Increasingly, carriers are adding new exclusions at renewal. The coverage picture should evolve quickly over the next two to three years as claims data builds and carriers calibrate.
Cyber carriers are now seeing claims tied to deepfake‑enabled fraud, voice cloning attacks, and AI‑generated phishing campaigns.18 D&O carriers are tracking suits tied to AI disclosures, governance failures, and AI washing. Employment practices carriers are watching litigation tied to algorithmic hiring and bias in automated decision‑making.
AI risk is no longer theoretical. It is already showing up in cyber, D&O, EPL, and professional liability underwriting.
For organizations, three practical steps matter now:
Insurers are still working through how AI‑related risks will evolve, but insureds that can demonstrate thoughtful governance, clear oversight, and documented controls around AI use are increasingly being rewarded at renewal.
Jason Patchen
EVP, National Director of Carrier Relationships
Missy Bolster
Vice President, National WC Specialist
Angela Thompson
Marketing Strategist, Market Intelligence & Insights
Brian Spinner
Marketing Specialist, Market Intelligence & Insights