Property & CasualtyMarket Update
Q3 2026
The underlying story for the commercial property and casualty market this year illustrates how much property’s softness is affecting the market even as several casualty lines remain genuinely challenging. The rate in which premiums increased declined an average of 2.0% across all account sizes in Q2, the second straight quarter rates have tapered. Ten lines reported rate decreases, led by commercial property, workers’ compensation, and cyber. While total P&C premiums averaged out to an increase quarter-over-quarter, the market’s softening cut this increase from 0.8% in Q1 to a 0.4% in Q2.1
Capacity is abundant across most lines right now, and that’s giving buyers real leverage, especially on property. However, this leverage isn’t universal. Carriers have been direct in their use of property and workers’ comp relief to help absorb the rate they still need from other casualty lines that are, in a word, challenging. Buyers coming out ahead second half of 2026 will be those who treat insurance as a business necessity, not a line item, and shoring up exposures and bringing complete, detailed data to renewal conversations.
Leading buyers treat insurance as a business lever, not an expense.
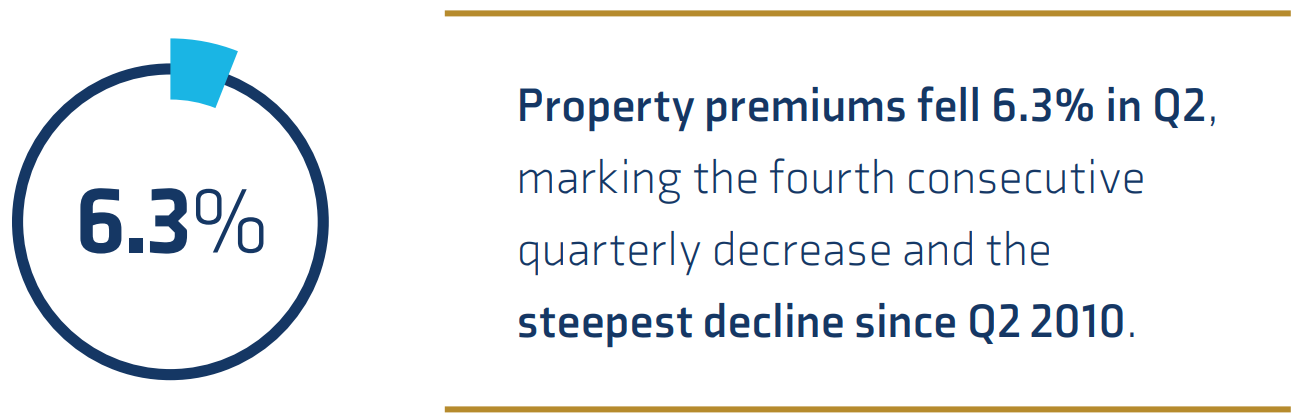
Property premiums fell an average of 6.3% in the second quarter, the fourth consecutive quarterly decrease and the steepest decline since Q2 2010.2 Capacity continues to increase in property and is a direct driver of the line’s softening, with reinsurance capital a main reason for the surplus. Record levels of dedicated reinsurance capital and continued catastrophe bond growth have kept property catastrophe reinsurance rates falling. Pricing declined faster at the June 1 renewal than in January and March, as risk‑adjusted pricing eased more rapidly driven by record levels of dedicated reinsurance capital and sustained growth in alternative capacity.3
That capital shows up as lower deductibles, particularly wind and hail, and multi‑year rate agreements are becoming the norm rather than an exception.
Capacity is providing relief beyond terms. Multi‑year rate agreements, once rare, are back on the table and being negotiated deal by deal. Wind and hail deductibles in the Midwest have come down meaningfully from a year ago, and those who bought buyback coverage on those deductibles are, in some cases, able to drop that layer entirely. Favorable property conditions have also benefited from stronger carrier balance sheets and the absence of a U.S. hurricane landfall in 2025, although global catastrophe exposure remains elevated. It’s important to note, these are conditions which can change quickly.
Property buyers have more leverage than they have had in years, but favorable conditions can reverse quickly.
Unlike property, casualty is not moving as one market. Several casualty lines recorded average decreases in premiums, including business interruption, cyber, D&O, and workers’ compensation extended its softening streak to eighteen consecutive quarters. Yet umbrella and auto rates remain stubbornly firm.

Commercial auto rose 4.5%, a moderation from Q1’s 5.8% increase.4 Umbrella remains a particularly challenging line, rising 5.3% in Q2, the line’s 35th consecutive quarterly increase. The severity and frequency of nuclear verdicts are primary factors affecting several casualty lines, including umbrella as well as auto, excess, medical, and general liability.5 Carriers willing to put up $25 million or more in a single umbrella layer have grown scarce industry‑wide, pushing buyers across sectors toward layered towers built from multiple carriers.
Geography matters more in auto right now than almost any other line. Louisiana, Texas, and Florida remain the most difficult territory, and the broader Southeast is still selective on auto terms even as carriers loosen up elsewhere. Some carriers are competing hard for new business across most lines right now, largely because they’re behind their own growth targets for the year, but a handful, particularly in auto, remain slow and deliberate even when they want the account. Severity is part of the reason why. Fleet renewals with any loss history are seeing real sticker shock, with per‑vehicle costs on some renewals reaching well into five figures, enough to threaten a small or midsize operator’s ability to buy coverage at all.
Workers’ compensation continues to defy the broader casualty trend. The line continues to be profitable, providing opportunities for rate decreases continuing in most states.6 But the line’s resilience shows signs of weakening. Rising medical costs, cumulative trauma litigation, and reserve adequacy concerns are now shaping underwriting and pricing conversations, and states with expanding presumption laws for conditions like PTSD among first responders and healthcare workers are seeing higher claim counts and severity. California is the clearest example of the pressure building beneath an otherwise stable line, reporting a combined loss ratio of 127%, well above break even, with regulatory and cost pressures that carry ripple effects into other states.7
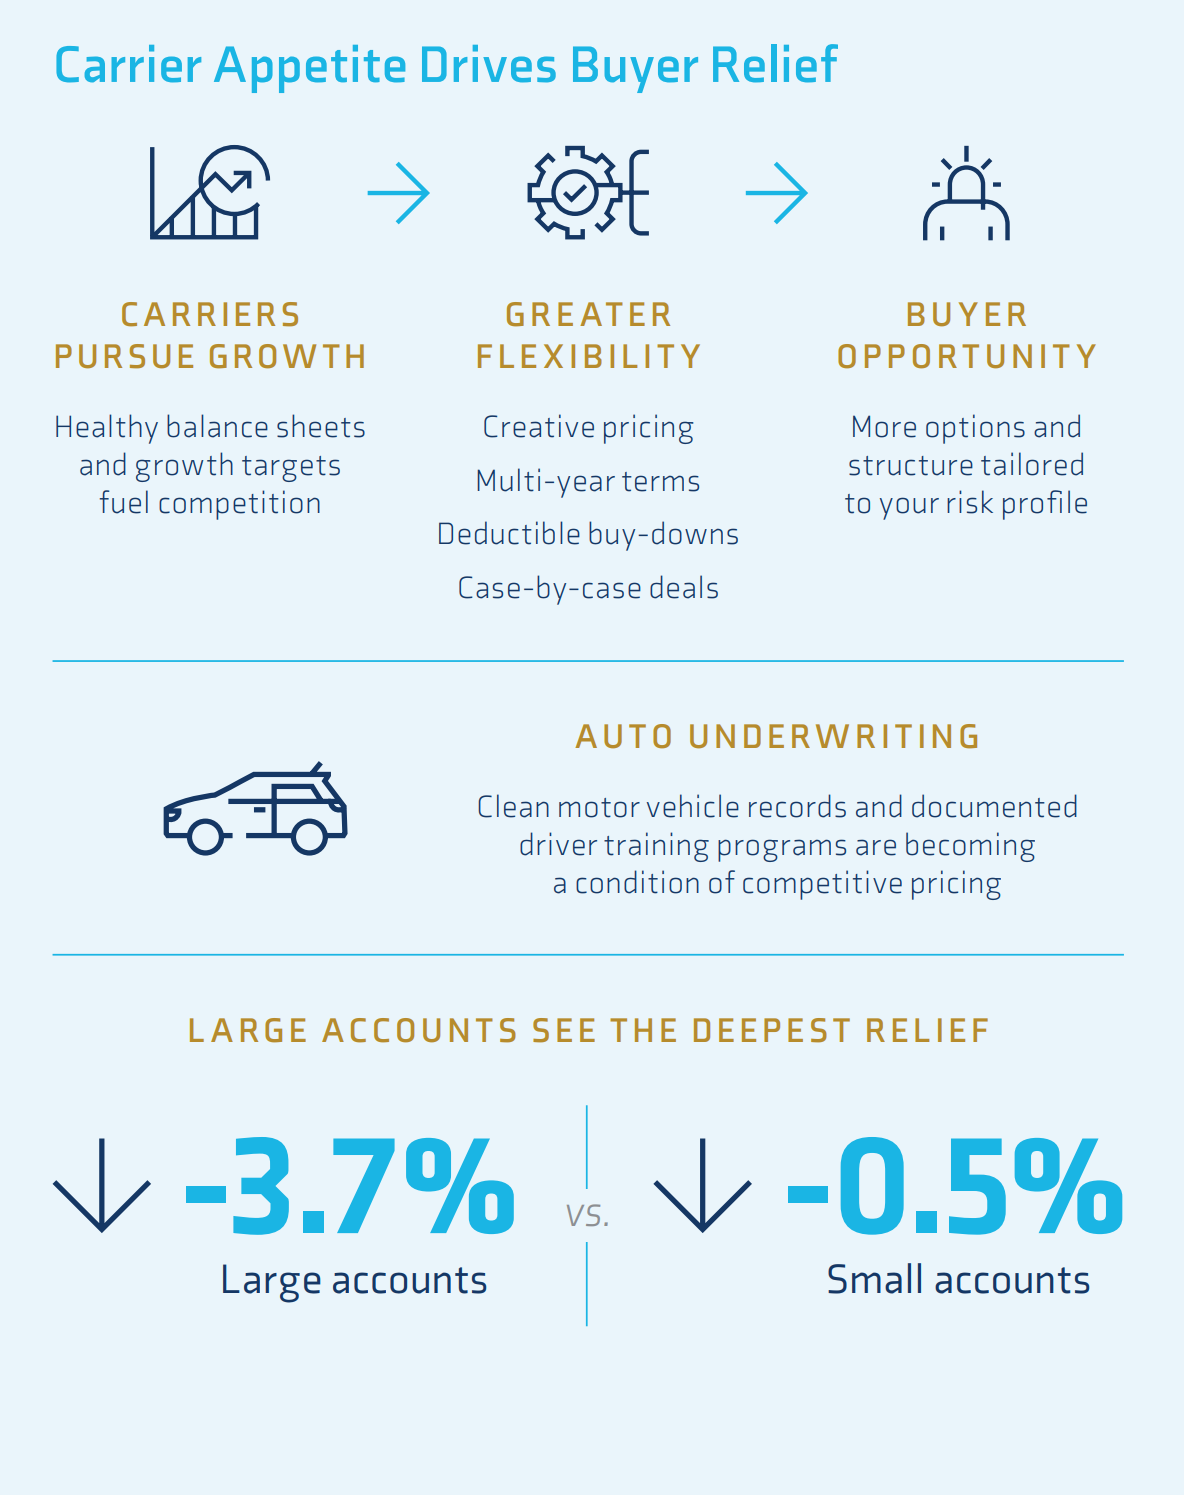
Underwriting appetite is being shaped as much by carriers chasing growth targets as by any reassessment of risk. Structuring deals often require a creative approach towards pricing, multi‑year agreements, and deductible buy‑downs, with more case‑by‑case flexibility than a year ago. This appetite also shows in what underwriters ask for. In auto specifically, clean motor vehicle records and documented driver training programs are becoming a real condition of competitive pricing, not a nice‑to‑have.
That same competitive pressure shows up in how carriers structure deals, not just how they price them. Multi‑year agreements, deductible buy‑downs, and case‑by‑case flexibility are all more available than a year ago. Some of that flexibility reflects genuine confidence, and some reflects carriers working to hit annual targets. The industry is realizing strong underwriting profit, which is allowing carriers to compete hard on property and workers’ comp because of overall healthy balance sheets.9 The industry continues to adapt to using new technologies helps their clients mitigate risks, such as water damage and collect and aggregate data in order to better understand and forecast market trends.10
Large accounts are seeing the deepest relief, down 3.7% this quarter, against 0.5% for small accounts.11
Litigation reform is starting to show measurable results where states have acted. Florida’s 2023 reforms cut insurer legal defense costs paid by insurers in the state from $3.46 billion in 2023 to $107 million in 2024, and eight more states passed reform legislation in 2025.12 While there are many states amenable to tort reform, many others are not so friendly. But, the legislative movement trend is counterweight to nuclear verdict growth.
U.S. P&C carriers using generative AI in production climbed from 8% in 2023 to 44% in 2025, while MGA premium reached $108.7 billion.
AI-assisted underwriting moved from pilot to mainstream in a single year. The share of U.S. P&C carriers with generative AI in production climbed from 8% in 2023 to 44% in 2025,13 and insurers using more advanced analytics achieved combined ratios roughly six points lower and premium growth three points higher than slower adopters.14 For clients, that’s showing up as faster underwriting turnaround and rising expectations for clean, structured data at submission.
MGA and delegated authority capacity keeps expanding rapidly. Premium written through MGAs reached $108.7 billion in 2025, up nearly 18% and the fifth straight year of double-digit growth, well outpacing the broader industry’s roughly 5% growth.15 That’s giving buyers more markets to shop, especially for harder-to-place or specialty risk.
Technology, tort reform and delegated authority are reshaping the market.
An evolving pattern worth watching involves habitability-related claims against landlords and property owners. Fewer of these claims are brought as a single, clean allegation. Instead, they’re being bundled into one filing and including multiple claims such as negligence, breach of the implied warranty of habitability, and wrongful eviction, often citing issues like improperly mitigated mold or long-standing HVAC and pest problems.
A Nevada jury awarded $6.6 million to three tenants in a toxic mold case, underscoring the financial severity of habitability-related litigation.
This is a growing litigation risk that has drawn attention from carriers, as courts hand down million-dollar awards in cases alleging landlords failed to maintain habitable conditions.16 While California is the nexus of this issue, the problem is spreading nationally. A Nevada jury recently awarded $6.6 million to three tenants over toxic mold tied to unfixed leaks.17 The response is being felt at the policy level, with broader, more generalized habitability exclusions becoming more common in the market.18
Habitability claims are becoming broader, costlier, and harder to resolve.
The bundling of allegations isn’t incidental. Structuring a bundled claim can trigger more than one line of coverage, pulling in general liability, pollution, and errors and omissions coverage simultaneously rather than leaving a claimant dependent on a single policy responding. That makes these claims more expensive to defend and harder to resolve than a straightforward premises liability claim, and one reason carriers are moving to tighten policy language around habitability exposure.
For property owners and managers, the practical takeaway is documentation. A clear, dated record of maintenance requests, remediation timelines, and habitability-related repairs is the clearest defense against a claim built to hit multiple coverages at once. Owners who can show a documented, responsive maintenance history are in a stronger position to defend against a claim than those who can’t, regardless of how it is framed.
Nuclear verdicts continue to impact businesses across industries, and carrier decisions regarding coverage. While there are organizations realizing a greater number of nuclear and thermonuclear verdicts, such as those in healthcare, technology, and finance, this rising tide is creating waves across most industries. Since 2020, these nuclear verdicts have increased by 309% and total number 273%, indicating this trend is not driven by outlier cases.19
Nuclear verdicts are no longer isolated outliers. Since 2020, their value has increased 309% and their frequency has climbed 273% across industries.
Beyond the broader casualty severity trend, one pattern worth flagging is more specific: a recurring wave of privacy‑related cyber claims tied to website tracking technology, often brought by the same small group of serial, self‑represented claimants under state privacy statutes. This activity runs in cycles, quiet for a stretch, then picking back up. Organizations with tracking pixels, chat tools, or analytics scripts on consumer‑facing sites should treat this as an ongoing exposure rather than a one‑time compliance check.20
This is a great opportunity for organizations to be proactive and take advantage of the improved property market conditions. Organizations should review property valuations and business interruption calculations to ensure they accurately reflect current exposures, while also exploring opportunities for deductible reductions and coverage enhancements that may provide greater protection at a competitive cost. In addition, organizations should evaluate whether multi‑year program structures align with their risk management objectives and could help lock in favorable terms over a longer period.
Yet, the current market rewards clients who understand that “soft market” doesn’t mean soft everywhere. Property and workers’ comp offer real leverage at renewal, and multi‑year deals and deductible relief are on the table for diligent buyers willing to shop. Auto and umbrella lines are in a completely different market environment. The relief carriers are extending on one side is, by their own account, funding what they still need on the other. That trade‑off won’t last forever. Buyers who use this window to strengthen their underlying risk profile, not just bank the savings, will be best positioned when the balance shifts again.
This is the moment to convert market relief into stronger risk resilience before the balance shifts again.
Maintain accurate and current exposure data
Provide organized, data‑driven renewal submissions
Document safety initiatives, loss control efforts, and risk improvements
Reinvest premium savings into long‑term loss prevention initiatives
Drew Hannan
Vice President, Commercial Lines
Krystal Keogh
Vice President, Client Experience
Mia Janes
Vice President, Claims
Missy Bolster
Vice President, National WC Specialist
Angela Thompson
Marketing Strategist, Market Intelligence & Insights
Brian Spinner
Marketing Specialist, Market Intelligence & Insights