ConstructionEconomic Overview
Q3 2026
This report provides a concise view of the construction economy by reviewing current market conditions and forward‑looking indicators. Current conditions are assessed through construction spending, employment trends, and material costs, while future momentum is evaluated through backlog and ConstructConnect’s Project Stress Index. Together, these measures help show where activity is strengthening, where pressure remains, and how risk may shift across project types.
Overall construction spending remains relatively steady, but performance varies by segment. Residential spending has improved modestly, while nonresidential spending remains flat as infrastructure, data centers, utilities and selected institutional categories offset weaker manufacturing activity. Contractors, owners, and developers may experience the market very differently depending on sector focus, project mix and geography.
Construction activity remains steady, but market pressure is shifting by segment, project type, and geography.
Residential construction spending increased 1.7% year‑over‑year in April, signaling modest growth after several months of uneven activity. While spending remains below the recent high reached in December 2025, the broader trend continues to point upward. Over the last 12 months, gains have been measured rather than significant, supported in part by a limited share of work from private individuals and developers. According to AIA, 12% of reported work comes from private individuals and 14% from developers, which helps explain the modest movement in put‑in‑place spending.1
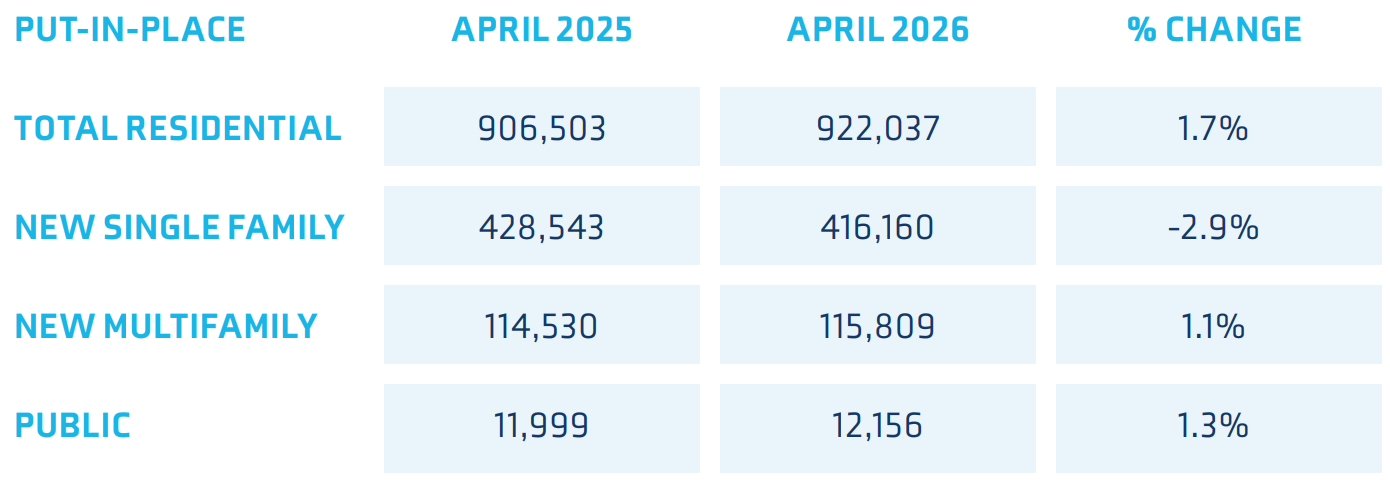
Source: Data compiled from the US Census Bureau. Value of Construction Put in Place in the United States,
Seasonally Adjusted Annual Rate. Data as of April 2026. Release date June 1, 2026.2
Nonresidential construction spending remained essentially flat through April 2026, increasing 0.1% month‑over‑month and 0.3% year‑over‑year. The muted headlines figure reflects uneven performance across subsectors, with infrastructure‑related categories and selected commercial segments offsetting a sharper pullback in manufacturing.
Manufacturing construction, which previously led growth, continued to soften and was down 18.4% year‑over‑year, signaling a meaningful reset from the prior peak investment cycle. Office construction continues to see steady growth. At the same time, several categories continue to post year-over-year gains, with religious construction spending up 20.3% and conservation and development rising 17.5%, both standing out as smaller but faster-growing contributors.
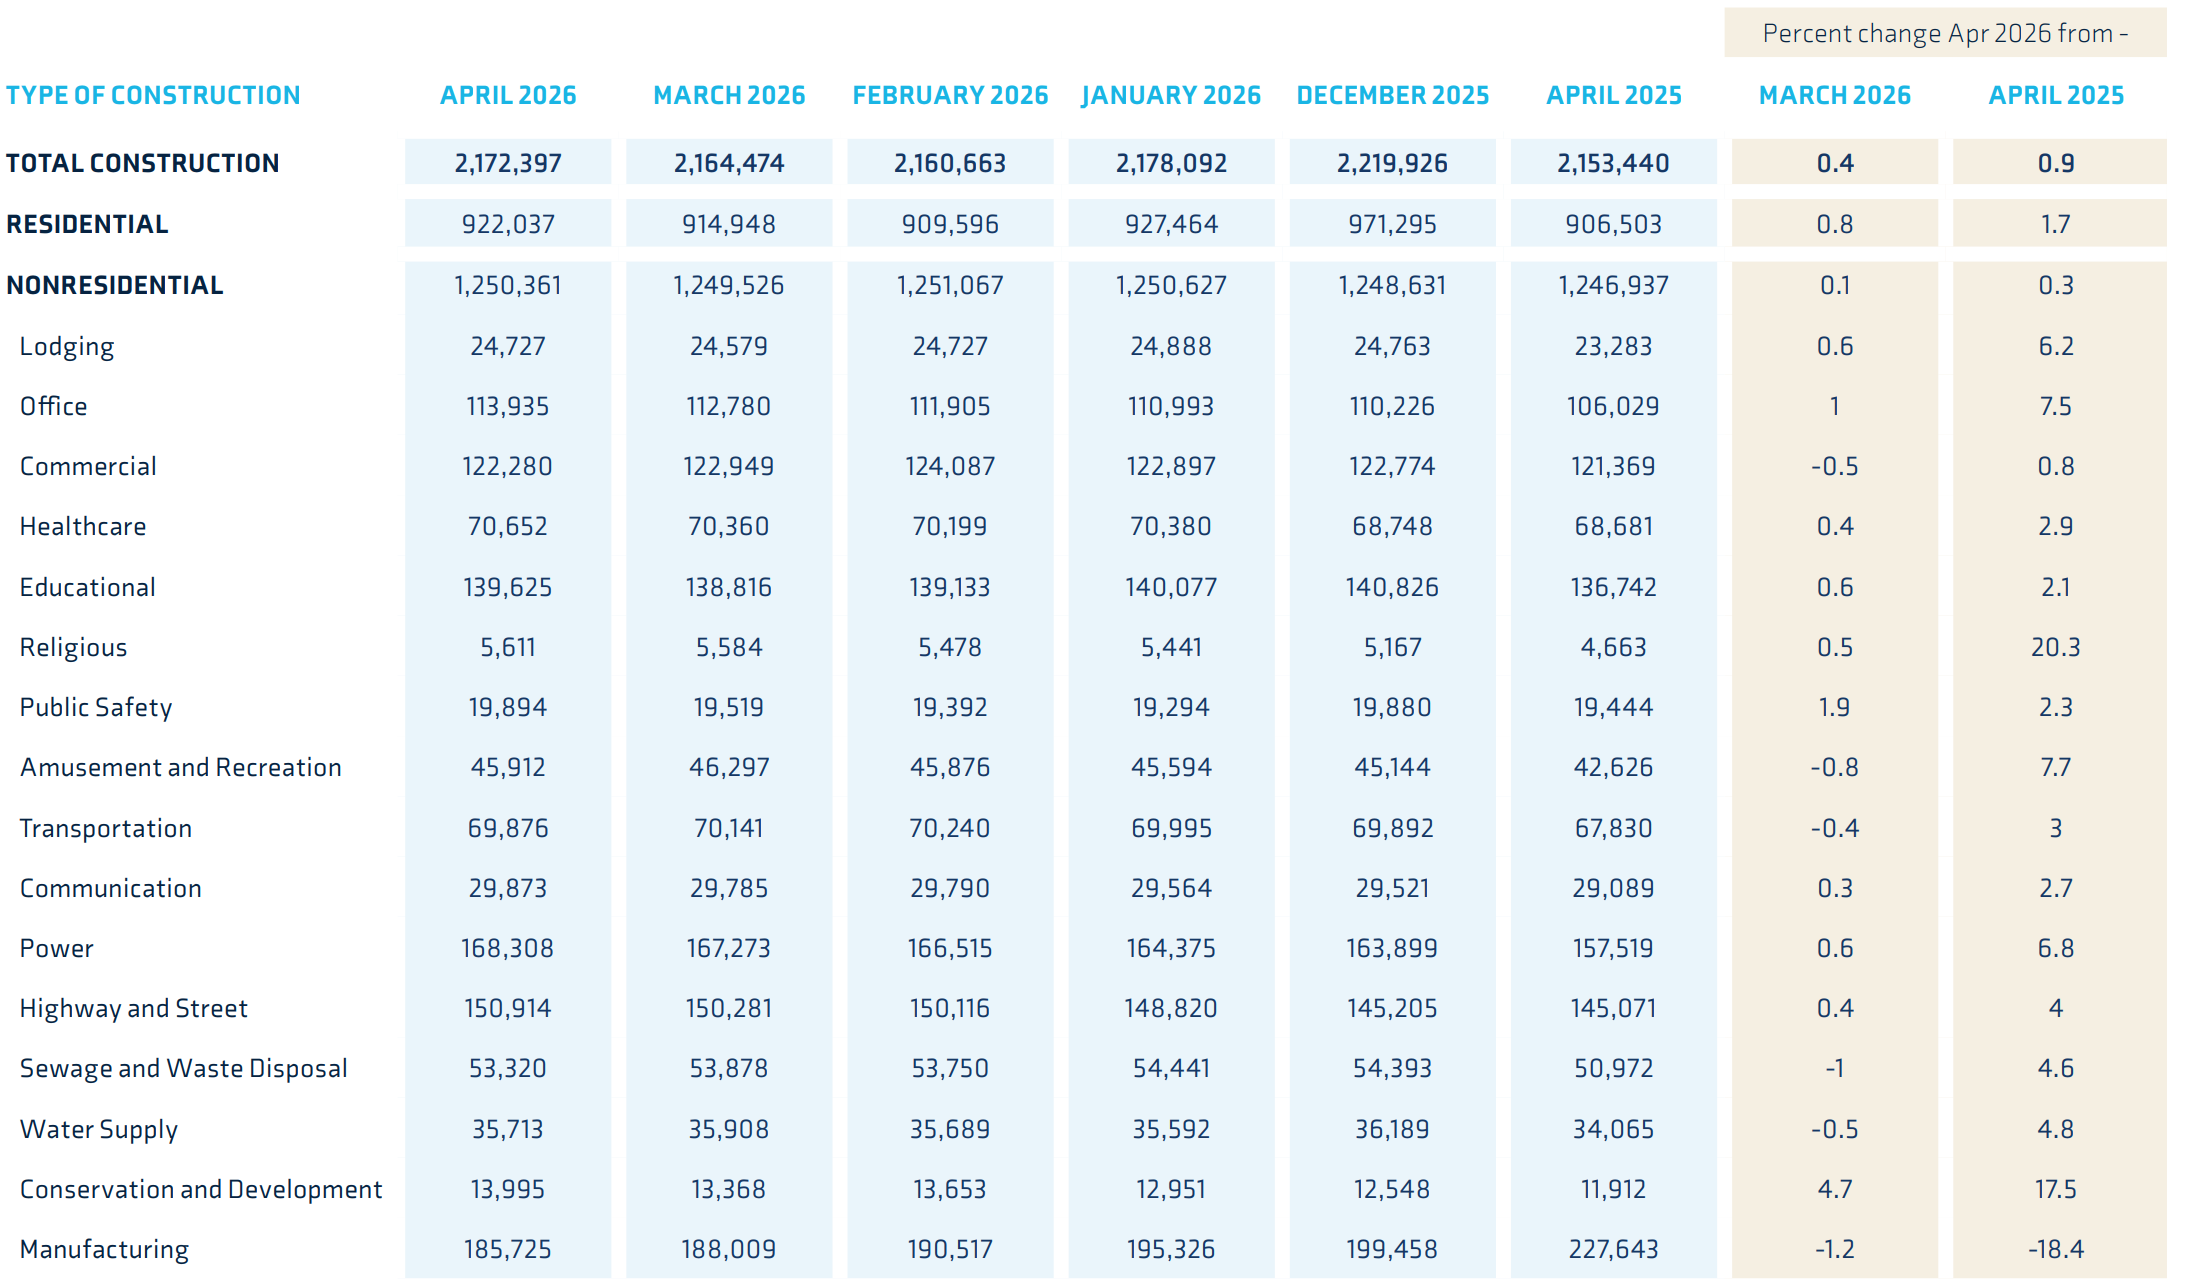
Source: US Census Bureau. Value of Construction Put in Place in the United States, Seasonally Adjusted Annual Rate. Data as of October 2025. Release date June 1, 20263
Construction employment gains are concentrated in nonresidential segments. Stakeholders in nonresidential segments are predicting that the growth in AI data centers will lead to significant investments in workforce development.4 Any investments into workforce development for nonresidential will lead to potential gaps in residential construction employment growth which is already had a notable decline (‑1.0%) and represent a continued downward trend similar to the previous month.
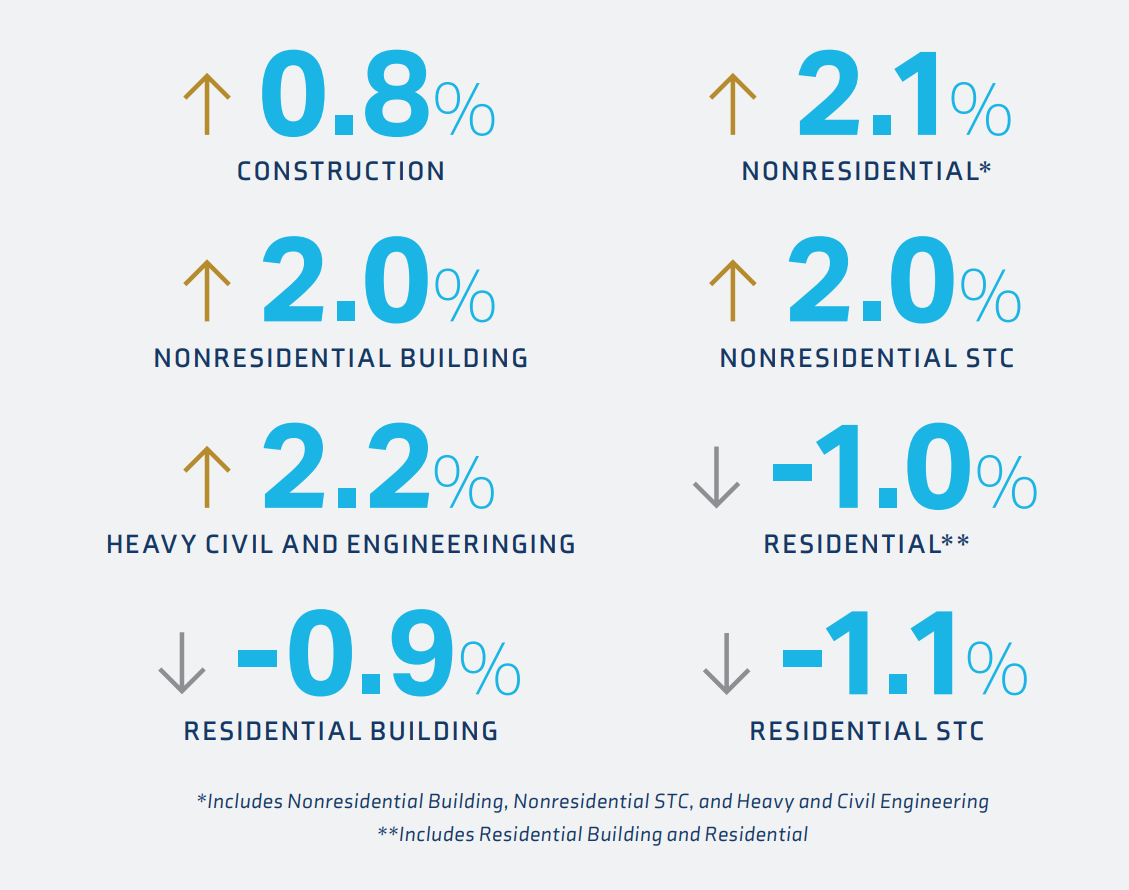
Source: US Bureau of Labor Statistics via ABC.org. Data as of June 5, 20265
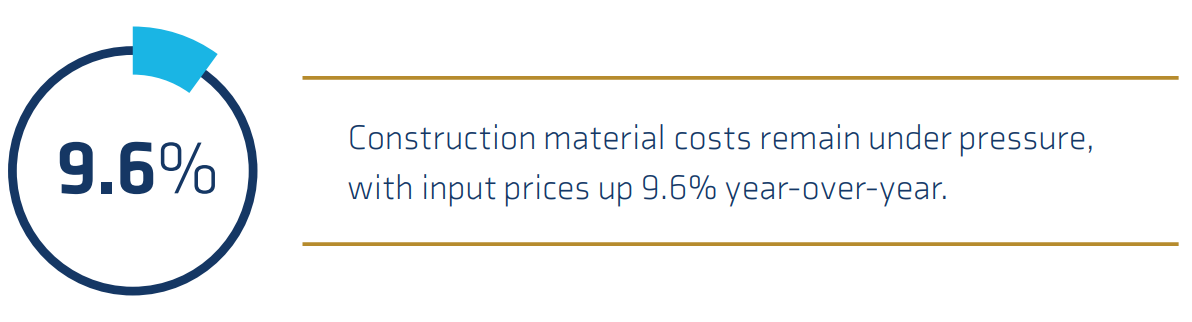
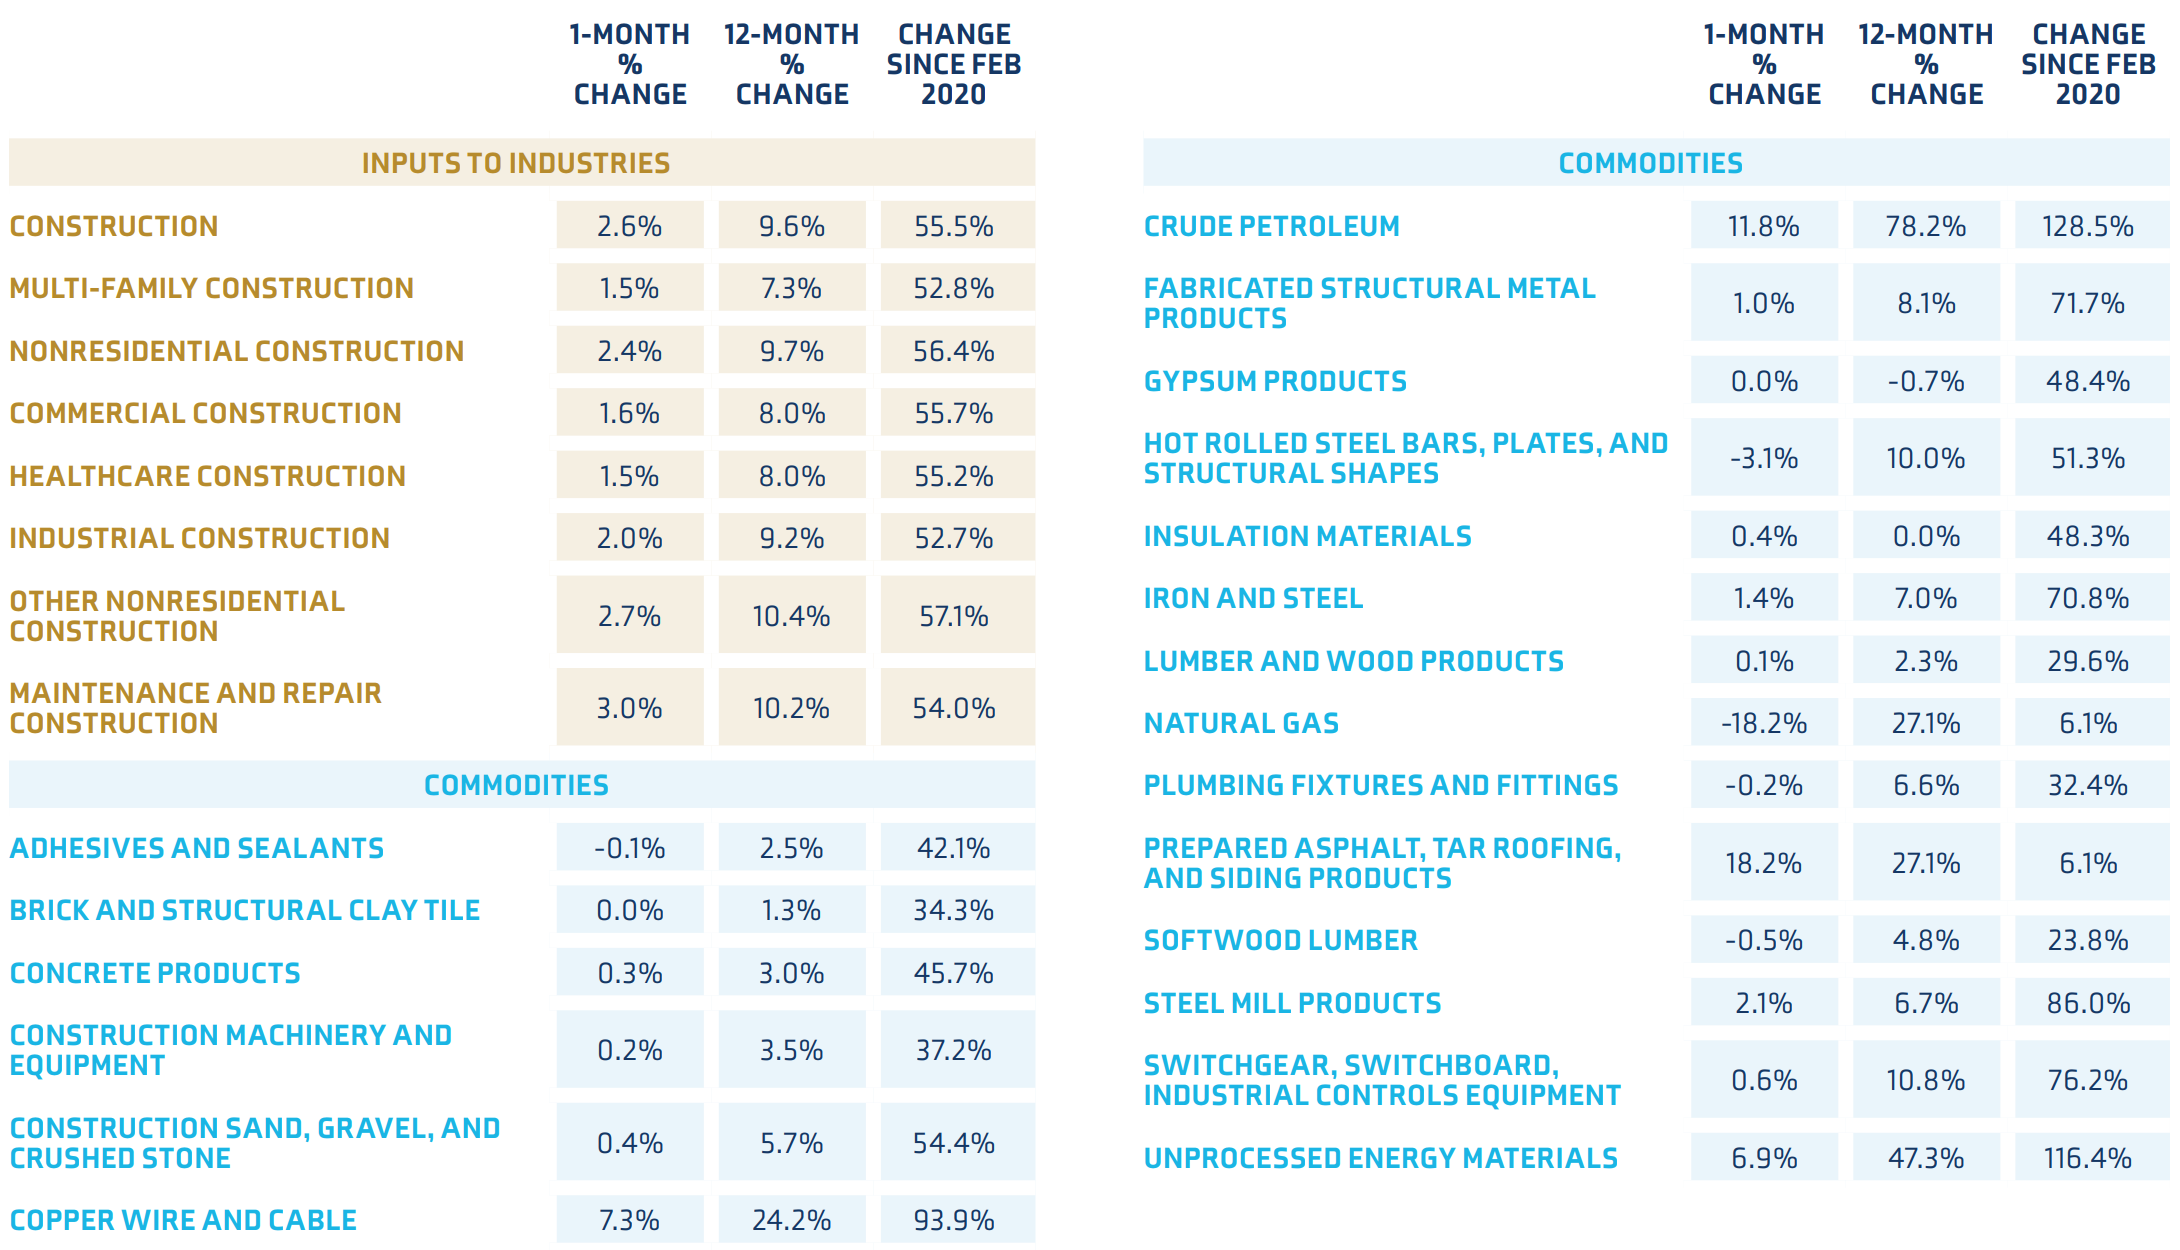
Material prices are significantly elevated. Inputs to construction remained elevated at 9.6% year‑over‑year. This has been following an upward trend since the start of 2026.
Crude petroleum prices surged in April of 2026 compared to the previous year because of the Iran conflict and remained elevated in May 2026. However, expectations for improved transit through the Strait of Hormuz will reduce some of the pressure on global trade.
Source: Associated Builders and Contractors6
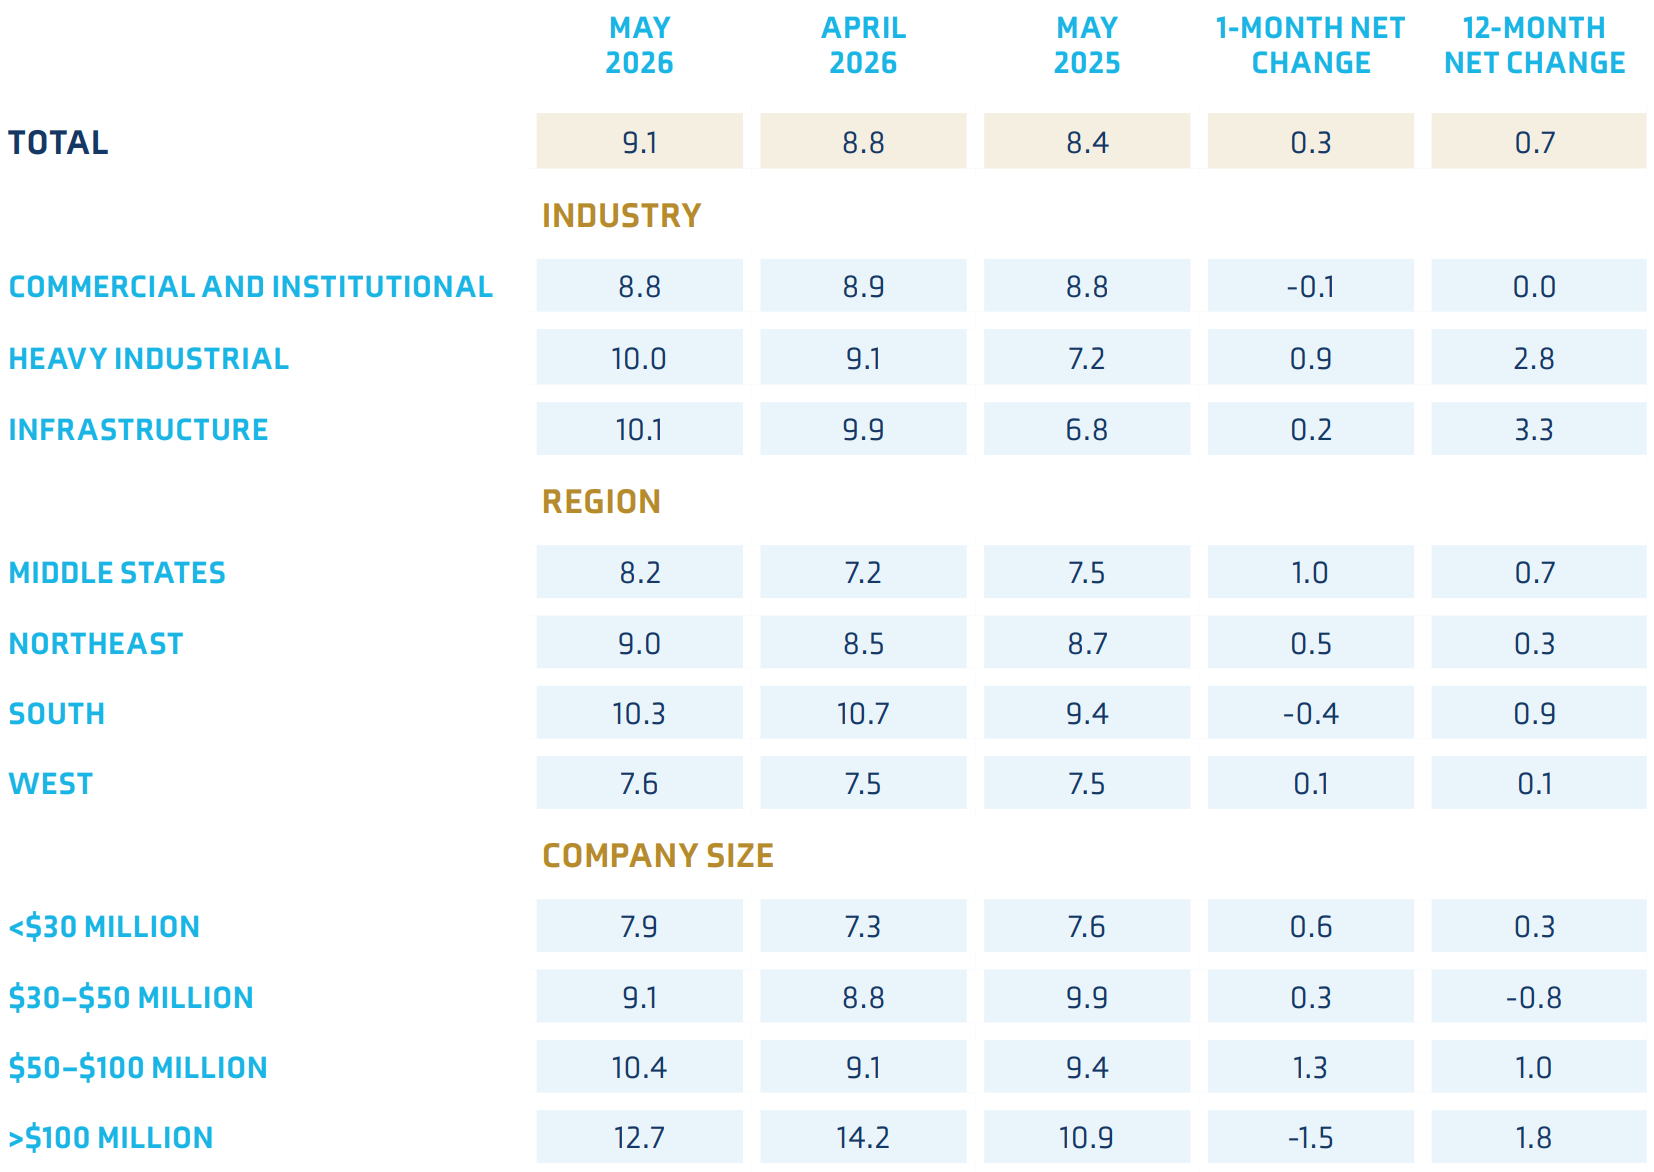
Construction backlog is strong at 9.1 months signaling consistent work under contract. The month net change improvement between regions except the South. The South still stands at the strongest backlog year‑over‑year.
Backlog for companies greater than $100 million are seeing a decrease by ‑1.5 compared to April 2026. Year-over-year, companies with $30–$50 million in revenue are down and have been trending downward since June 2024. Overall commercial backlog has hovered average 8.6 since January 2024.
A recent Federal Energy Regulatory Commission (FERC) order may also influence future backlog. On June 18, FERC directed the nation’s six regional grid operators to justify or revise the tariff rules that govern how data centers, factories and other large power users connect to the electric grid. As these projects move through additional review and study requirements, timelines could lengthen and affect when work ultimately moves forward.7
Source: Data from Associated Builders and Contractors Construction Backlog Indicator. Data from June 2025 to June 20268
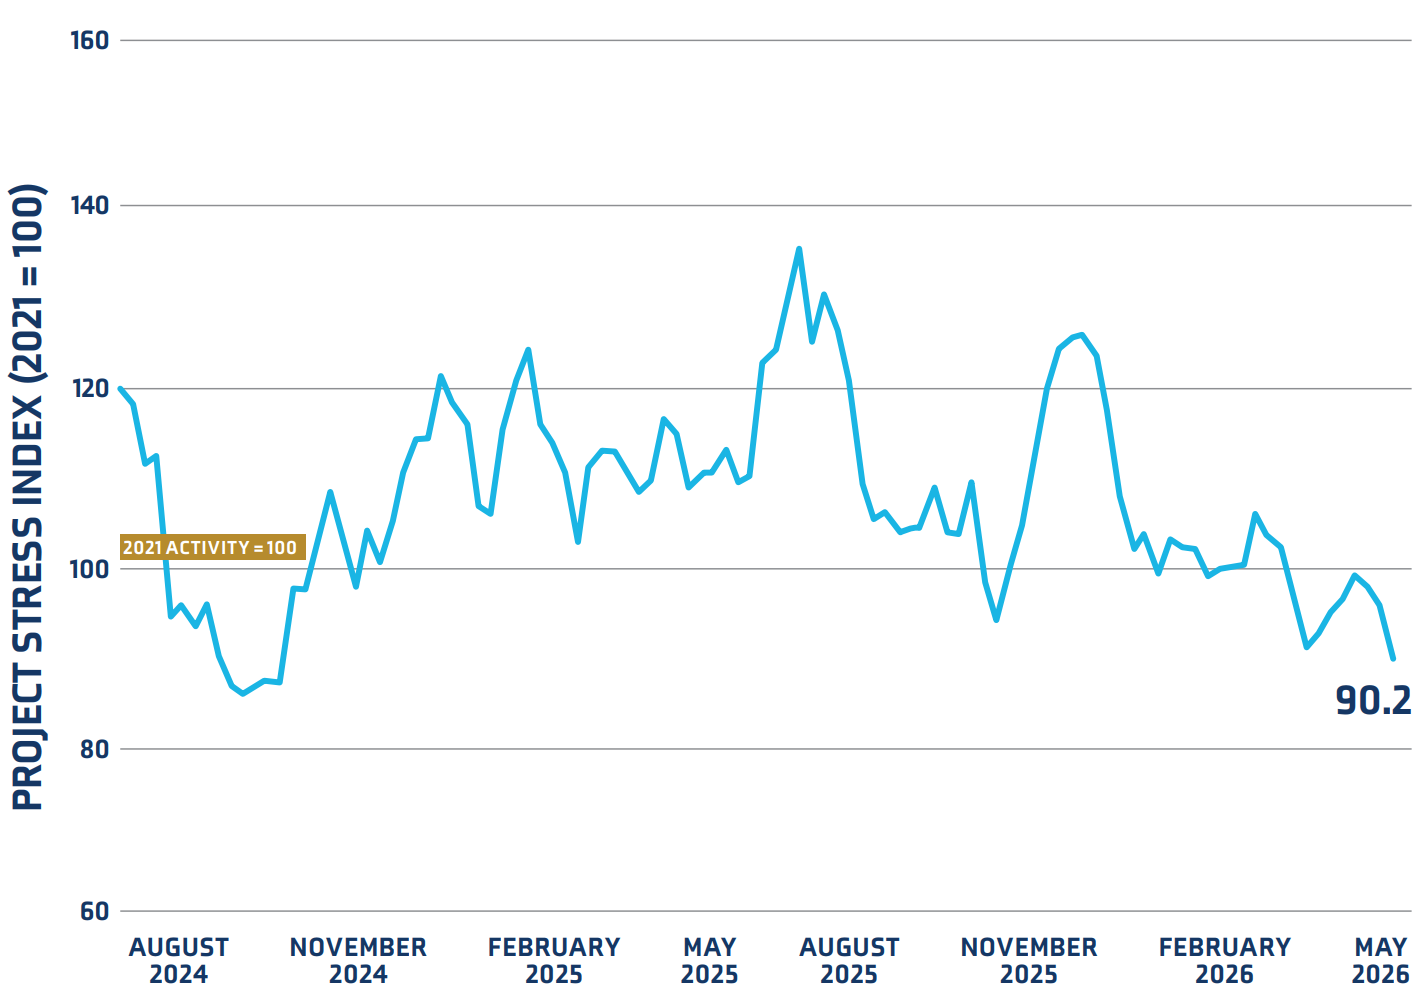
Project stress levels have decreased, reflecting stabilization on construction planning and execution. Project abandonments have declined significantly with delay bid dates and on hold projects declining modestly. This solidifies that contractor projects are less stressed than the previous month.
Source: ConstructConnect. Project Stress Index.9
The construction economy continues to show resilience, but growth remains uneven across sectors. Residential spending has improved modestly, while nonresidential activity remains relatively flat as strength in infrastructure, data centers, utilities, and selected institutional categories offsets softer manufacturing construction. At the same time, elevated material costs, shifting labor needs, and changing project mix continue to place pressure on contractors, owners, and developers.
Looking ahead, strong backlog suggests continued demand, particularly in markets supported by large‑scale infrastructure and data center investment. However, longer timelines, power availability concerns, workforce constraints, and cost volatility may influence when projects move forward and how risk is allocated. Even as project stress indicators show signs of stabilization, the market still requires disciplined planning, clear contract controls and regular review of insurance, surety and risk management programs.
For construction stakeholders, the key takeaway is not that the market is slowing or accelerating uniformly, but that risk is becoming more specific to project type, geography, labor availability, and cost structure. Organizations that monitor these shifts closely, pressure‑test coverage and values, and align workforce, contract, and project controls with current market conditions will be better positioned to manage uncertainty and capture opportunity in the months ahead.
Amanda Klein
SVP, Regional Construction Practice Leader
Brian Stockton
SVP, Regional Construction Practice Leader
Angela Thompson
Marketing Strategist, Market Intelligence & Insights
Brian Spinner
Marketing Specialist, Market Intelligence & Insights