Construction
Economic Overview & Market Update

Download PDF

This report recognizes that the construction sector can thrive during a general economic downturn due to the lag time between project initiation and completion, while maintaining active spending by owners. Evidence suggests projects are bigger and fewer than in years past. Understanding the availability and potential of projects for contractors requires a close look at spending dynamics, influenced by the broader economy and owners’ decisions to undertake construction projects. To gain a comprehensive view of the current state of the construction economy, we examine construction spending and indicators that provide insight into future expectations. By leveraging this data, we aim to construct a clear picture of the environment and offer insights into the associated risks and insurance implications.

The construction sector thrives even amid a general economic downturn.

Construction Economic Outlook

Construction Economy Current State

The Construction Spending Tree starts with total construction spending and is further divided into specific components. Not all contractors will benefit from the overall spending in each region. The annual spending rate year-over-year is examined to see how future spending helps with budgeting.

ANNUAL SPEND RATE – YOY (In Millions)
Source: U.S. Census Bureau. Construction Spending. Data as of August 1, 2024.1

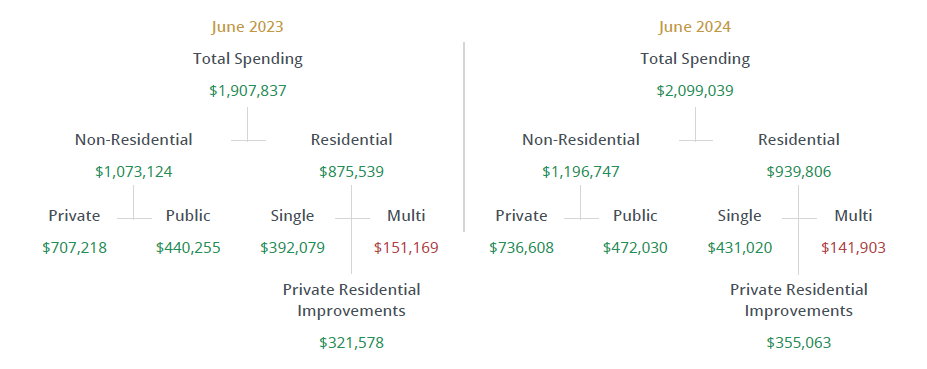
The year-over-year annual spending rate shows a positive trend across all sectors, with the exception of multifamily. While this is not the first occurrence, we anticipate this trend will continue as multifamily starts are down 12.8% year-over-year. The private residential improvements sector has improved from last quarter turning positive, which may encourage private equity firms to continue to acquire business in this arena.

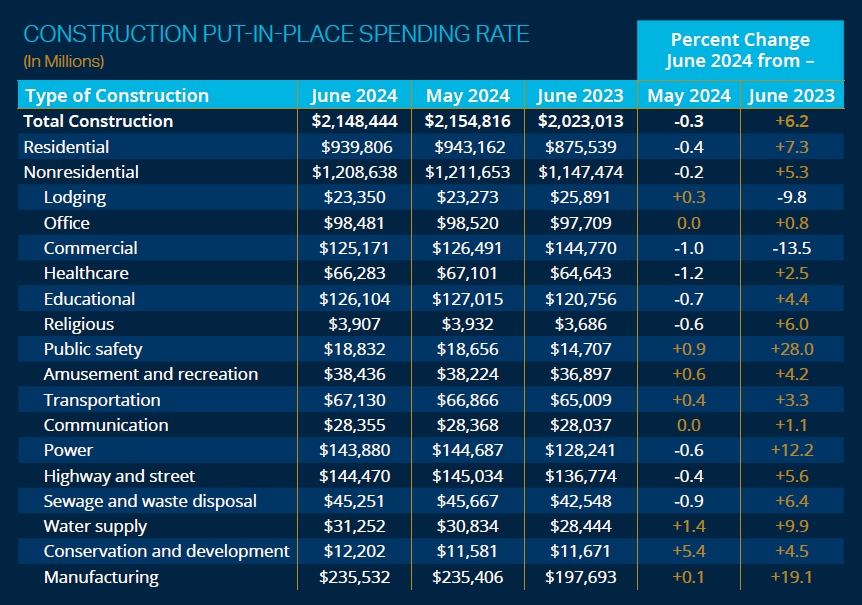
The total construction spending rate in all sectors is 6.2% year‑over‑year. The nonresidential spending rate is up 5.3%, and the residential spending rate is up 7.3%, which is a reversal from 2023. Overall spending has declined by 5.3%, reflecting a continued downward trend from May to June. The month‑over‑month decrease of 0.3% indicates a deceleration in spending activity, highlighting a shift in the overall pace of spending.

Residential Spending

In 2023, the average residential spending rate was $875 billion. This year, the rate has increased to $939 billion, marking a 7.3% rise. This is a significant shift from the previous year.

  • Single-Family Homes: Single-family homes account for most of the spending increase, with a year‑over-year growth rate of 9.9%. This marks a dramatic reversal from last year when single‑family home spending was negative. Even in the wake of higher interest rates, single‑family construction is ongoing.
  • Multifamily Homes: Multifamily spending, which includes attached townhomes and apartments, is down significantly by 6.1% year-over-year and shows no sign of reversing. This starkly contrasts with the previous year when multifamily homes led the category. Apartments are being built at a degree less than the year prior, and possible saturation of the market due to projects that have come online after sitting.
  • Private Residential Improvements: Introduced as a category four months ago, private residential improvements have increased spending by 10.4% as consumers spend on home improvements.
Spending Rate Ytd (in Millions)
Residential Spending RateYTD 2023YTD 2024Percent
Change
Total Residential$875,539$939,806+7.3
New Single-Family$392,079$431,020+9.9
New Multifamily$151,169$141,903-6.1
Private Family Improvements$321,578$355,063+10.4
Source: U.S. Census Bureau. Construction Spending. Data as of August 1, 2024.1
What This Means for You
  • Although new apartment construction starts are declining, the number of completed units entering the market is increasing due to previously high levels of construction activity. In the first quarter of 2024, the completion rate for apartments in buildings with five or more units surged by 27.4% compared to the same period in 2023.
  • This higher completion rate for multifamily construction in 2024 is expected to exert downward pressure on rent growth due to the increase in supply. As the elevated level of apartments currently under construction is finalized, multifamily construction spending is anticipated to decrease in the upcoming quarters.2
  • Overall, total residential spending has increased by 7.3% year-over-year, driven primarily by the surge in single-family home investments, while multifamily lags. As a result, HVAC contractors, electrical contractors, home improvement professionals, kitchen remodelers, and bathroom remodelers are expected to experience an increase in spending rates.

Nonresidential Spending

The nonresidential spending rate is up 5.3% year-over-year, but there remains a two‑year lag from the U.S. Census Bureau, resulting in increased construction spending.

  • Public safety is up 28%, which can include jails and courthouses. This presents a favorable opportunity to build and secure the next project.
  • Manufacturing, representing $235 billion in spending, is the largest category of pure commercial construction. It currently stands at a 19.1% increase. It is the category boosting all nonresidential spending to help get to 5.3%. It’s the largest spending category and continues to be the catalyst supporting the total nonresidential construction.
  • Commercial construction represented the second largest category of total construction spending a year ago and is now fifth largest down 13.5%
  • Highway and street, in addition to power spending continue to remain high in both spending categories.

At first glance, manufacturing spending appears robust. However, considering the broader context, it’s clear that the nonresidential construction spending rate has cooled off and is starting to taper off.

Source: U.S. Census Bureau. Construction Spending. Data as of August 2024.1
What This Means for You
  • The government has started spending more of our tax dollars on construction. Of all total construction, 22% is being spent by either local, state, or federal governments. Sometimes, it’s federal government spending given locally or at a state level.
  • The EEOC has increased their focus on discrimination and harassment in the construction industry by providing new recommendations for preventing and addressing these issues.
    • In 2023 The agency published a 2023‑2027 Strategic Enforcement Plan (SEP), Building for the Future: Advancing Equal Employment Opportunity in the Construction Industry. The report states the construction industry had some of the most “egregious incidents of harassment and discrimination” investigated by the agency.
    • On June 18, 2024, the EEOC published “Promising Practices for Preventing Harassment in the Construction Industry.” The report identifies core practices to help prevent and address harassment in the construction industry, including committed and engaged leadership; consistent and demonstrated accountability; strong and comprehensive harassment policies; trusted and accessible complaint procedures; and regular, interactive training tailored to the audience and the organization. Guidance directly from the EEOC can be found here.

Construction Economy Future State

Backlog

Backlogs have decreased by 0.9 months from a year ago, now at 8.4 months. Backlog seeks to assess the backlog of work or the increase in value of projects on the contractors’ records. Contractors of all sizes are experiencing a decline in backlog compared to the previous year. This is calculated based on the current month’s total remaining value of projects in backlog, divided by the total revenues of the previous 12 months, then multiplied by 12. Backlogs grow when construction starts outpace the spending rate. If contractors can secure new contracts at a greater speed than they complete existing projects, backlogs increase. This trend has reversed over the past two years, and we are seeing backlogs decrease.

Last year, backlog averaged 9.3 months. However, as of July 2024 it has reduced significantly to 8.4 months. Backlog improvement remains hopeful.

Contractors of all sizes are experiencing a decline in backlog compared to the previous year.

Construction Backlog Indicator
Source: Associate Builders and Contractors. Backlog Indicator. Data as of August 13, 2024.3
What This Means for You
  • Smaller contractors under $30 million may be better prepared to withstand the impacts of the backlog decrease.
  • While backlogs remain stable, there is growing concern for momentum to see output change.

ConstructConnect’s Project Stress Index

ConstructConnect has a database of projects and created the Project Stress Index. This Index gives insight into the quality and stability of the construction backlog.

PROJECT STRESS INDEX COMPOSITE

A seasonally adjusted, equal weight measure of delayed, on hold and abandoned projects.

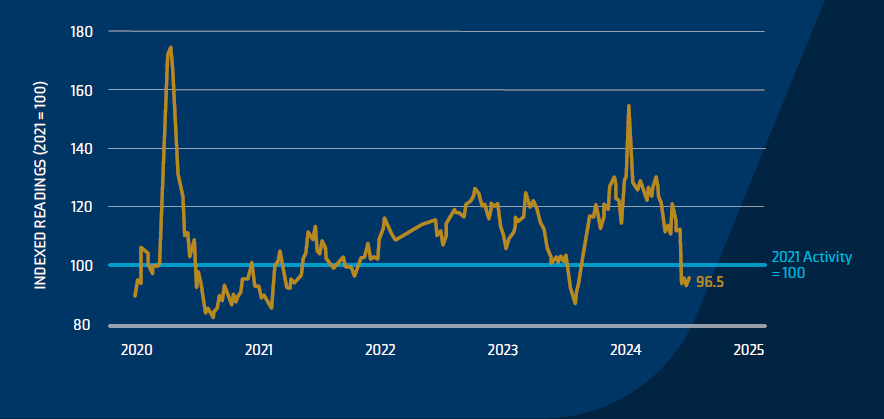
Abandoned jobs contributed to two-thirds of the decline within the private sector. Jobs put on hold have happened in the public sector, with the segment spending 22% of total construction spending. Nearly four-fifths of the jobs with bid date delays were in the public sector.

Subcomponent Index of The Psi
Source: ConstructConnect. Project Stress Index. Data as of August 7, 2024.4
What This Means for You
  • The Project Stress Index has steadily tracked above 100, meaning backlogs were not guaranteed to progress. The average backlog is 8.4 months, less stressful than two months ago but still indicative of a challenging environment.
  • We’ve seen a continuous decline in project stress, suggesting that the remaining backlog is strong.
  • Multiple government agencies may need to review spending before spending occurs, which could contribute to the stress index.
  • The momentum is picking up, and projects are picking up. States are expanding their total number of projects with twice as many projects planned this year than last year.
  • Regional construction activity has been challenging for much of America, but the contemplated spending data points to potential changes.

Architectural Billings Index

The Architectural Billing Index (ABI) is a leading indicator in the construction industry. The ABI, surveyed by the American Institute of Architects (AIA), measures whether architects are billing more or less than the previous months. If the Index is above 50, it indicates growth, while below 50 suggests a decline.

Aia Architecture Billing Index, National
Source: AIA Architecture Billings Index. August 21, 2024.5
What This Means for You
  • The ABI is running at a lower rate of 46.4 than we’ve seen year-over-year, which is unfavorable. Design is taking place at a lower rate month after month.
  • Construction starts are needed to see construction spending. It isn’t until a project is planned and designed to before it moves to a construction start.
  • The ABI helps forecast expectations about future spending based on construction starts. Construction spending over the next 9 to 12 months is very muted. Projects are still being designed, and shovels are still going into the ground, however, not to the degree that we’ve been experiencing in the last couple of years.
  • This trend is significantly impacted by timing. The ABI has been under 50 for a full year. We should start seeing a decline in construction starting today and forceable future over next six months.

Construction Starts

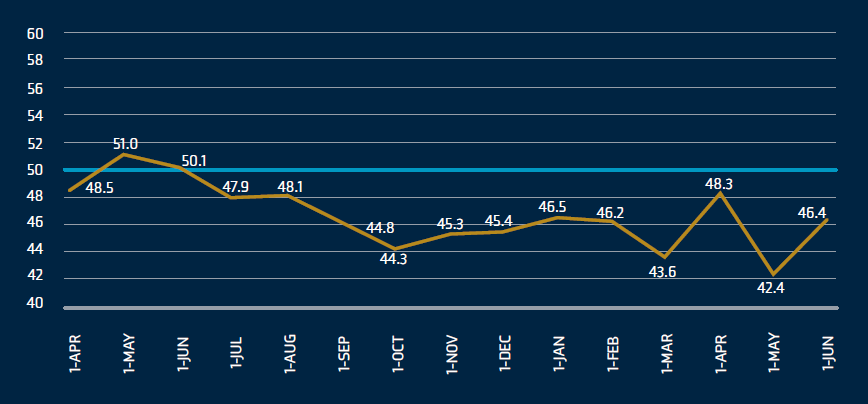
As a commercial rule of thumb, you have 20% of the project that gets spent in the first 12 months, in the next 12 months, you have 50% of the project spending, and finally, 30% of the project spending that occurs in the following twelve months. Any given year, you have the total amount from when the project starts, which indicates the total spending for the future. This is a result of payments being dispersed over time with various people.

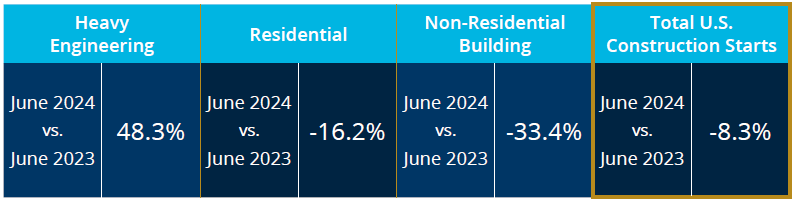
Year-over-year, the number and value of total construction starts have declined by 8.3%. This trend signifies a cooling and flattening of construction spending. The overall trend for nonresidential construction shows a 12.2% decline compared to the same period in 2023. This indicates flattening of construction spending compared to the previous year.

Breaking down the sectors, we see significant declines in key areas:

  • Non-residential: Down 33.4%
  • Residential: Down 16.2%

Regional construction starts highlights include Alaska, which has seen a remarkable 116.7%6 increase in nonresidential construction starts and 132.3% in heavy engineering construction starts.7

Construction Economy Snapshot
Source: ConstructConnect. Construction Economy Snapshot. July 2024.8
What This Means for You
  • While specific sectors and regions show growth, the broader trend indicates a significant cooling in nonresidential construction starts, with many sectors experiencing substantial declines. This dynamic will likely influence project planning and resource allocation shortly and flattening of construction spending compared to the previous year.

Producer Price Index

Costs for materials and labor constitute a significant portion of construction projects. Demand remains high for materials like concrete, sand, gravel, and crushed stone, showing a 7.4 12‑month percent change, which may be attributed to the government not wanting to pay as much for sand to complete projects.

Source: U.S. Bureau of Labor statistics Via ABC.org. August 13, 2024.9
What This Means for You
  • Increases in price or supply chain issues are likely to continue with concrete-related materials.
  • Know the importance of how the supply chain will impact your business and if you are poised to manage any significant delays caused by being unable to access materials. Supply chain, rate, and union external factors may present challenges for businesses.
  • Identify key suppliers and their main suppliers, to shore up supply channels to avoid supply chain disruption if it needs to go through shipping channels. Identifying a strategy prior to supply chain disruption will be crucial.

Supply chain, rate, and union external factors may present challenges for businesses.

In Summary

Over the past couple of years, optimism within the construction sector has waned, with design activities proceeding at a slower pace than in the past. While sales remain stable, concerns about profitability persist, potentially impacting the top line. Despite this, total construction spending has increased by 6.2% yearly. Nonresidential spending has risen by 5.3% year‑over‑year, and residential spending, particularly in single-family homes, has hit 9.9% year over year despite challenging economic conditions. We continue to add more construction employees in all sectors.

The backlog of work is being depleted faster than new jobs are being secured. However, the private sector maintains a solid 8.4 months of work. Nonetheless, decreasing backlogs may cause commercial contractors to feel uneasy about prospects.

The Architectural Billings Index has shown a four-month trend of decreasing design activity, indicating that future construction starts and spending will likely decline in the coming year. Persistently lower billings suggest that we are at the beginning of a downturn in nonresidential construction spending, which is expected to continue through the end of this year and into the next.

Over the next six months, we anticipate a significant slowdown in construction spending, influenced by the broader economic environment. Even if interest rates were to drop dramatically, it would take approximately six months before new projects could commence. Therefore, we expect the next six months to represent the most substantial decline in construction activity. We are hopeful that changing factors will help the industry recover and stabilize by 2025.

Contact
Contributors

Michael Campo
EVP, National Construction Practice Director

Angela Thompson
Sr. Marketing Specialist, Market Intelligence & Insights

Brian Spinner
Sr. Marketing Coordinator, Market Intelligence & Insights

Sources
  1. United States Census Bureau. (2024, August 1). Monthly Construction Spending, June 2024. United States Census Bureau. https://www.census.gov/construction/c30/data/index.html ↩︎
  2. Zhao, N. (2024, June 3). Eye on Housing: Private Residential Construction Spending Edges Up in April. National Association of Home Builders. https://eyeonhousing.org/2024/06/private-residential-constructionspending-edges-up-in-april/ ↩︎
  3. ABC. (2024, August 13). ABC: Contractor Confidence Tumbles in July, Construction Backlog Unchanged. ABC. https://www.abc.org/News-Media/News-Releases/abc-contractor-confidence-tumbles-in-july-constructionbacklog-unchanged ↩︎
  4. Guckes, M. (2024, August 7). Construct Connect’s Project Stress Index – August 2024. ConstructConnect. https://www.constructconnect.com/construction-economic-news/constructconnects-project-stress-indexaugust-2024 ↩︎
  5. AIA Architecture Billing Index. (2024, August 21). ABI July 2024: Firm billings decline at modestly slower pace. AIA. https://www.aia.org/resourcecenter/abi-july-2024-firm-billings-decline-modestly-slower-pace ↩︎
  6. ConstructConnect. (n.d.) July 2024 industry snapshot 2024 year to date ranking of top 20 states by $ volume of Nonresidential construction starts. ConstructConnect. https://projects.constructconnect.com/hubfs/Industry%20Snaphot%20Packages%20(PDF)/JULY%2024%20Construction%20Economic%20Snapshot%20Package.pdf ↩︎
  7. ConstructConnect. (n.d.). July 2024 industry snapshot 2024 year to date ranking of top 20 states by $ volume of heavy engineering construction starts. ConstructConnect. https://projects.constructconnect.com/hubfs/Industry%20Snaphot%20Packages%20(PDF)/JULY%2024%20Construction%20Economic%20Snapshot%20Package.pdf ↩︎
  8. ConstructConnect. (n.d.) July 2024 Construction Economic Snapshot Package. ConstructConnect. https://projects.constructconnect.com/hubfs/Industry%20Snaphot%20Packages%20(PDF)/JULY%2024%20Construction%20Economic%20Snapshot%20Package.pdf ↩︎
  9. ABC. (2024, August 13). Construction Materials Prices Increase in July for First Time Since April, Says ABC. ABC.org. https://www.abc.org/NewsMedia/News-Releases/construction-materials-prices-increase-in-july-forfirst-time-since-april-says-abc ↩︎