ConstructionEconomic Overview & Market Update
Q1 2026
To provide a comprehensive view of the construction economy, current conditions are reviewed through current spending, labor conditions, and material costs, followed by indicators that offer insight into future trends. Forward-looking measures include backlog, construction starts, and ConstructConnect’s Project Stress Index. Total construction spending is broken down into key segments, recognizing that not all contractors benefit equally across categories.
Spending patterns in various sectors continue to shape contractor activity. While overall year-over-year spending is relatively flat, individual categories display varying trends both on an annual basis and across rolling twelve month periods.
Residential construction spending has softened over the past five months, driven primarily by continued weakness in new single-family construction. While multifamily activity has been more stable, overall residential momentum remains constrained by elevated inventory levels and slower absorption rates.
| Put-in-Place | Oct 2024 | Oct 2025 | % Change |
|---|---|---|---|
| Total Residential | 937,550 | 926,474 | -1.2% |
| New Single Family | 427,368 | 401,451 | -6.1% |
| New Multifamily | 117,620 | 114,304 | -2.8% |
| Public | 12,584 | 11,184 | 12.5% |
Source: Data compiled from the US Census Bureau. Value of Construction Put in Place in the United States, Seasonally Adjusted Annual Rate. Data as of October 2025. Release date January 21, 2026.1
Nonresidential construction spending has remained largely flat, reflecting uneven performance across subsectors. While infrastructure-related categories continue to provide support, manufacturing and select commercial segments have softened, limiting overall growth. Total nonresidential spending put-in-place declined 1.0% year-over-year as of October 2025.
Manufacturing construction, which previously led growth, has declined consistently over the past five months and is down 9.6% year-over-year, signaling the end of a peak investment cycle. Infrastructure related categories, including power, transportation, sewage and waste disposal, and water supply, continue to show year-over-year growth, supported by public funding. Religious construction spending increased 14.5% year-over-year, standing out as a notable but relatively small contributor.
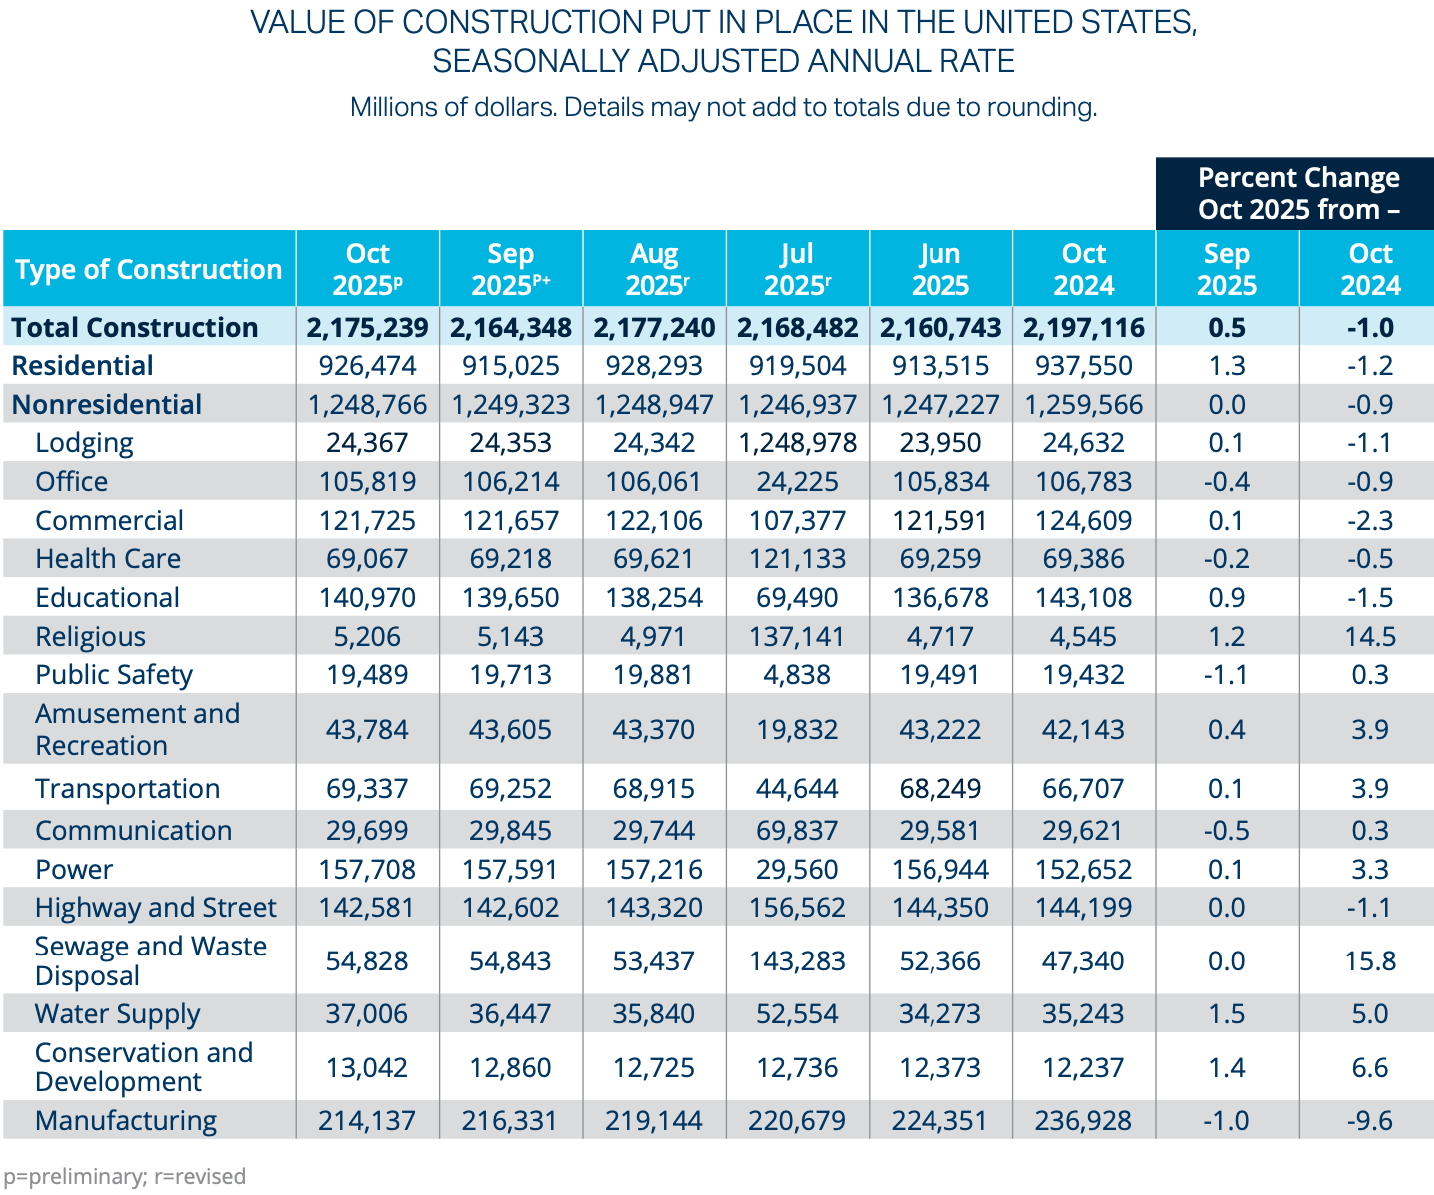
Data centers remain a significant driver of nonresidential construction activity, particularly in terms of project starts, backlog, and overall exposure concentration. While total put-in-place spending attributed to data center has remained relatively flat in recent months, this reflects the timing of capital deployment rather than a weakening of underlying demand.
Data center activity, classified within the office sector, has totaled $105.8 billion in October 2025 and has declined modestly year-over-year. However, this aggregate view masks the outsized influence of data center projects within the nonresidential pipeline. Current spending levels largely reflect capital allocations and construction activity initiated earlier in the investment cycle, while the recent surge in large-scale data center starts is still working its way into reported spending figures.
This dynamic helps explain the apparent disconnect between flat near-term spending and the strong momentum observes across construction starts, backlog, and specialty trade activity. Data centers continue to dominate large dollar project starts, with three of ConstructConnect’s top ten projects in December 2025 tied to data center development.3
Construction employment growth remains modest, with gains concentrated in nonresidential segments. Long term labor availability challenges persist, driven by workforce attrition and skill-specific shortages.
Long term projections indicate approximately 7% employment growth by 2034, largely driven by replacement needs as workers exit the labor force. Skilled trades, including brickmasons, blockmasons, stonemasons, and tile and marble setters, are projected to decline by approximately 10%, tightening labor availability. Electrical contractor employment is expected to remain flat despite rising demand for data centers and power infrastructure.
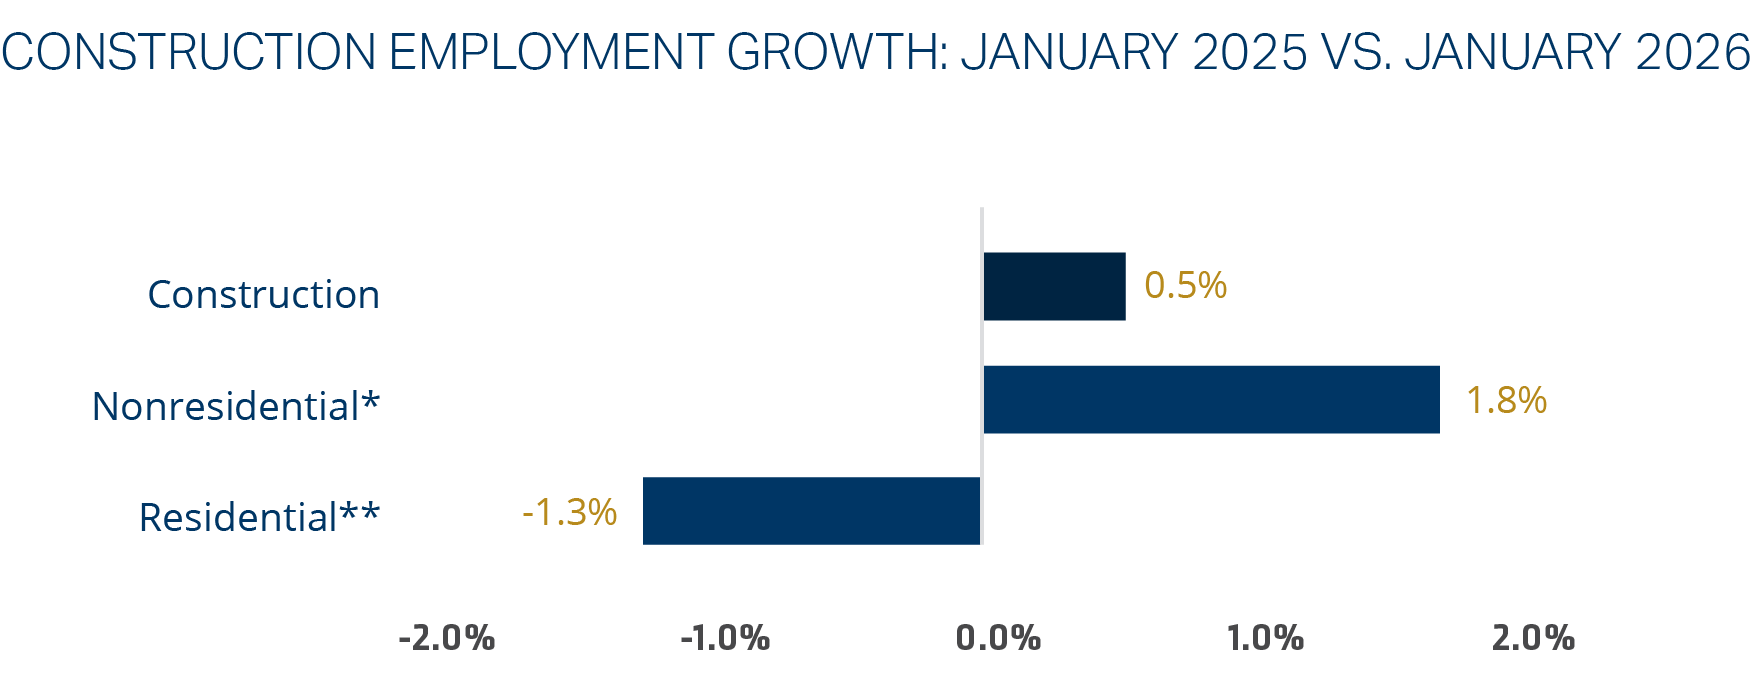
*Includes Nonresidential Building, Nonresidential STC, and Heavy and Civil Engineering
**Includes Residential Building and Residential
Source: Adapted from U.S. Census Bureau of Labor Statistics via ABC.org. Data as of February 11, 2026.4
Immigration Reform
Immigration audits, raids, and investigations carry distinct employer risks, including fines, penalties, criminal exposure, operational disruption, and reputational harm. Defense costs may arise in all scenarios. Employment practices liability (EPL) coverage varies and should be reviewed to assess potential applicability.
Wage Theft
Unpaid wage claims filed by subcontractor employees may name the general contractor. EPL coverage is typically focused on the primary general contractor rather than subcontractors, and insurers continue to apply heightened scrutiny to these exposures.
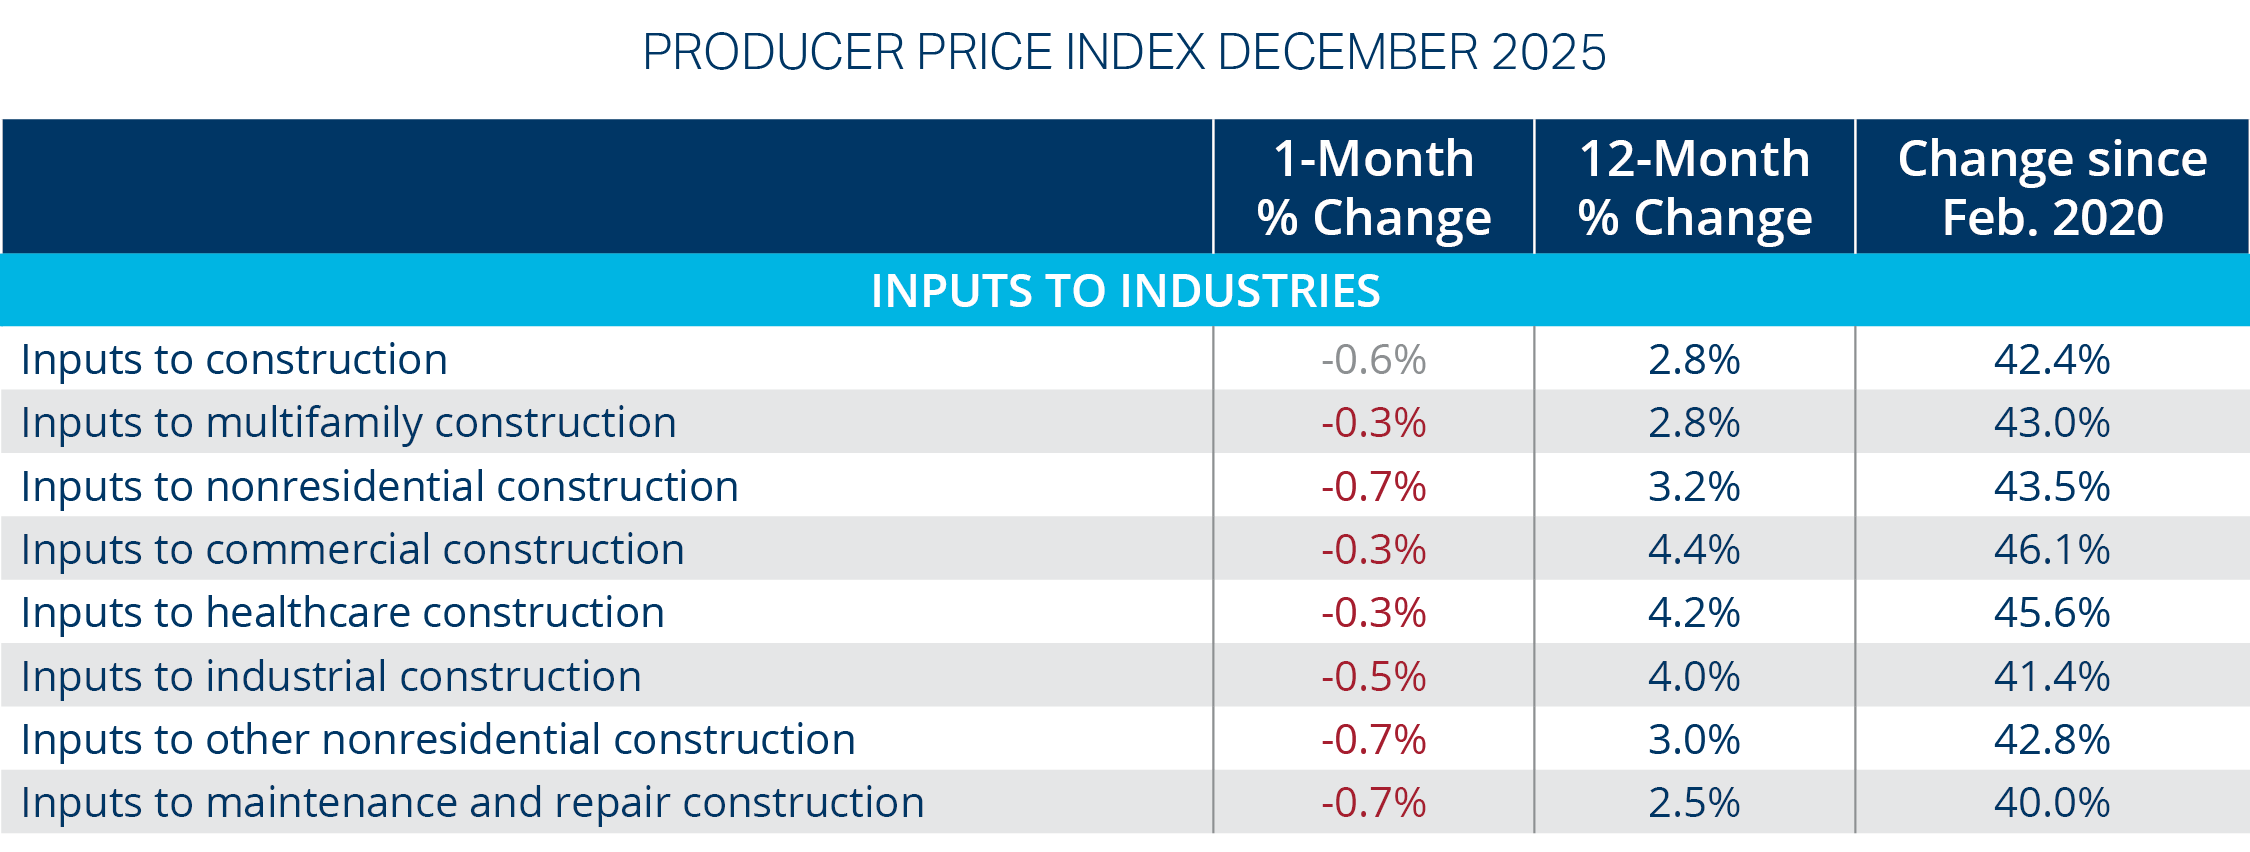
Construction material prices remain elevated, driven by tariffs and supply chain friction, though contractor pricing behavior suggests limited near-term pass-through to bids. According to AGC, 70% of contractors report being impacted by tariffs, yet only 40% have responded by raising bid prices.5 Approximately 45% of firms report no significant supply chain disruptions; reported issues are primarily concentrated in electrical components and power distribution equipment.5
Inputs to construction increased 2.8% year-over-year in December 2025, with nonresidential and industrial inputs showing the strongest gains. Copper wire and cable experienced the largest twelve-month price increase (22.3%), aligning with reported electrical supply constraints.
*Includes Nonresidential Building, Nonresidential STC, and Heavy and Civil Engineering
**Includes Residential Building and Residential
Source: Adapted from U.S. Census Bureau of Labor Statistics via ABC.org. Data as of February 11, 2026.6
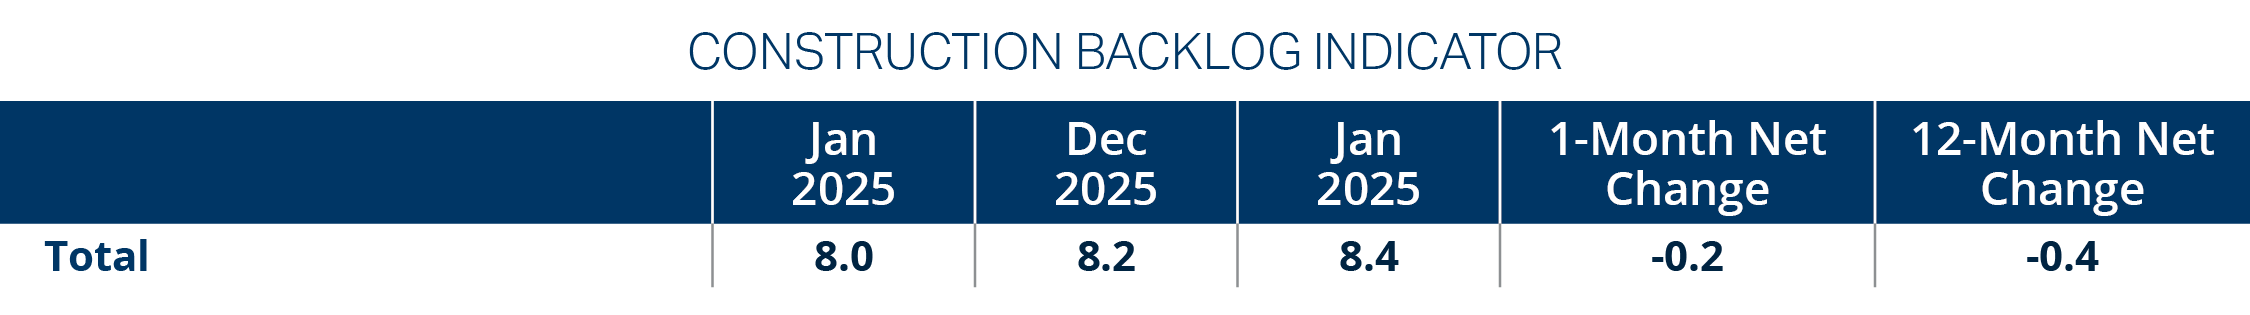
Construction backlog remains stable at approximately eight months, signaling continued work under contract despite uneven market momentum. However, backlog strength is increasingly concentrated among large contractors, driven primarily by data center activity.7
Overall backlog levels indicate a steady pipeline, though sentiment suggests declining sales expectations over the next two quarters. Contractors with annual revenue exceeding $100 million report the strongest backlog, reflecting disproportionate participation in large data center projects. Smaller contractors experienced a notable backlog decline during 2025, underscoring growing segmentation across the industry.
Regional backlog remains strongest in the South, while the West shows the greatest variability and lowest average backlog over the past two years.
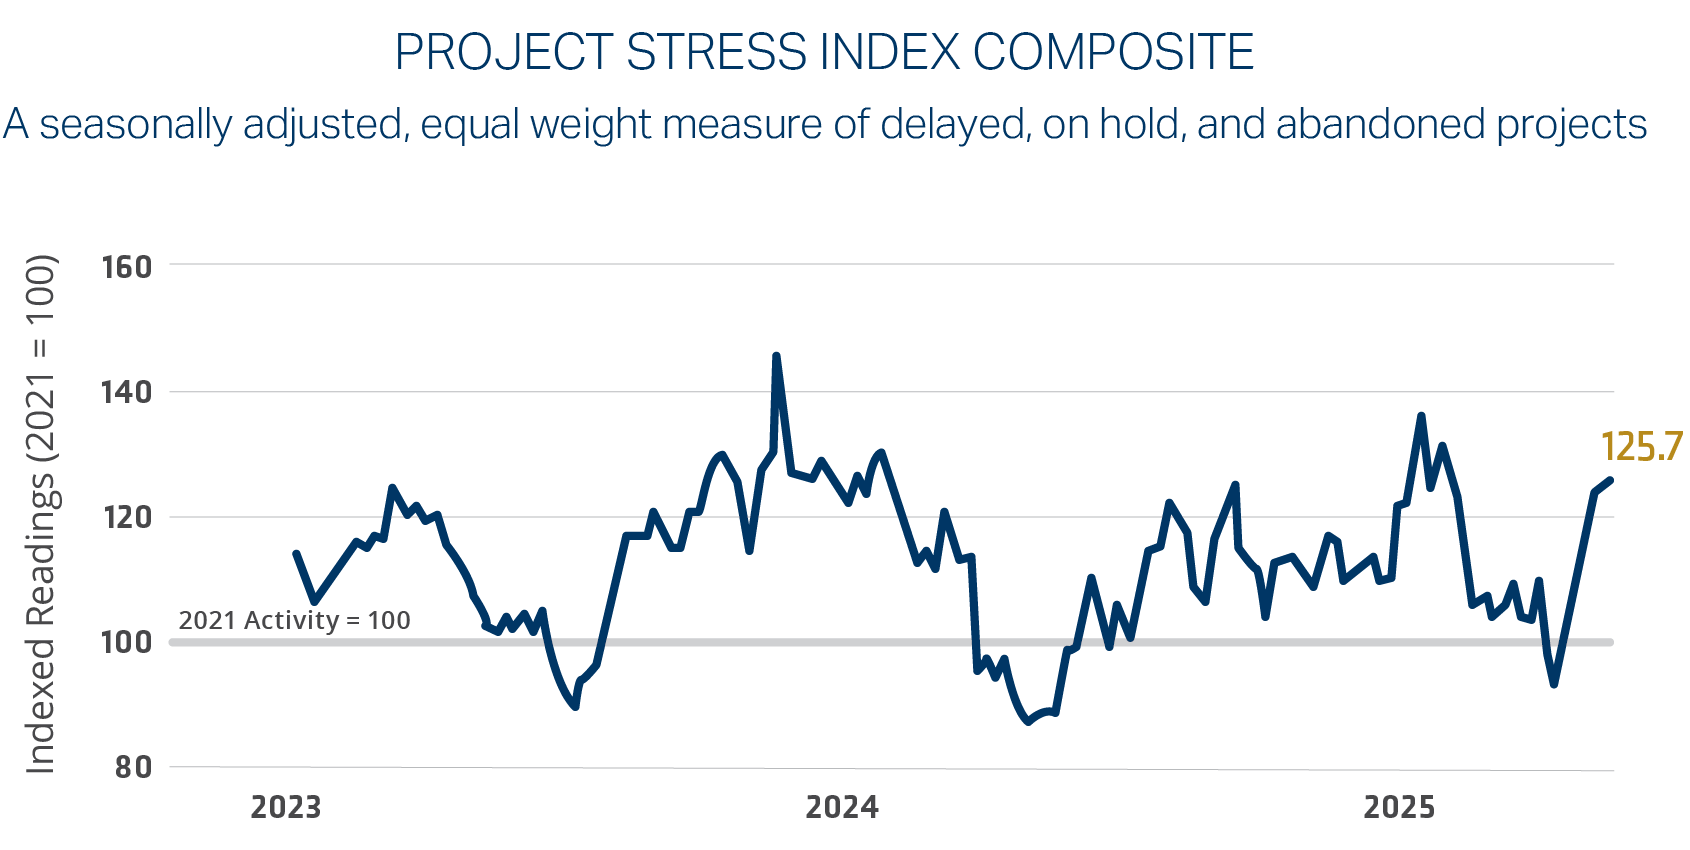
Project stress levels have increased, reflecting rising uncertainty across construction planning and execution. Elevated levels of on-hold and abandoned projects signal growing pressure on project pipelines despite stable backlog levels. According to AGC, 63% of contractors report that at least one project has been postponed, scaled back, or canceled within the past six months.9
Nonresidential construction starts remain uneven, with growth concentrated in large dollar projects, particularly data centers and select infrastructure categories. Starts for January 2026 reached $80.3 billion. This marked the highest January on record. Regional performance varies widely, reflecting localized investment cycles and mega project activity. Data centers account for the largest share of nonresidential starts and dominate the largest dollar-value projects.
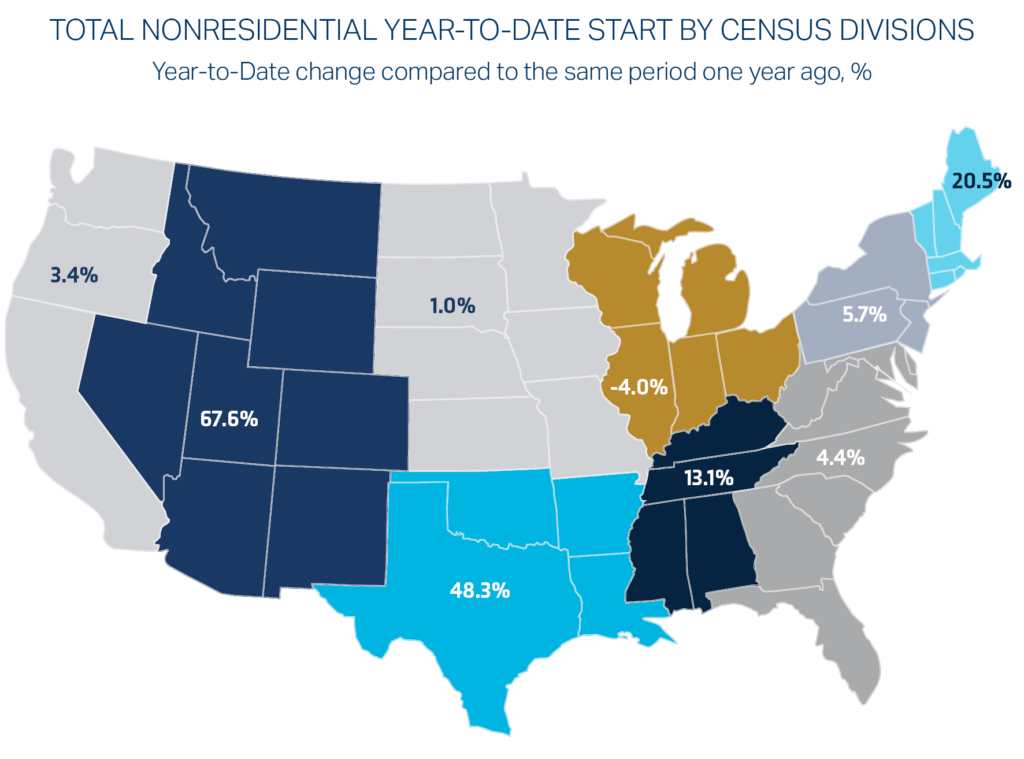
Year-to-date, the Mountain region has significantly outpaced other regions, driven largely by mega projects in Arizona. Arizona recorded a substantial year-over-year increase in starts, reflecting a combination of data center development, infrastructure expansion, and available undeveloped land. Starts in the West South Central region, heavily influenced by Texas, lagged relative to the Mountain region’s growth.
Insurance market conditions remain mixed across construction-related lines, with pricing stabilization in some areas offset by continued claims pressure and underwriting discipline in others. Rates across nine property and casualty lines indicated softened market conditions.12 Coverage will remain contingent by risk profile.
General liability – Coverage remains stable, but market conditions have not meaningfully softened and continue to be challenging. Underwriters are applying increased scrutiny in plaintiff-friendly jurisdictions. Insurers continue to deploy targeted exclusions and are reducing exposure to insureds engaged in litigation financing.
Workers’ compensation – Pricing remains favorable, and the line remains profitable, supporting a competitive market in 2026. However, caution is warranted as claim frequency has declined while severity trends higher.
Automobile – Commercial auto loss ratios continue to deteriorate and market conditions continued to result in premium increases. Underwriters are placing heightened emphasis on safety programs, telematics, driver training, and loss performance.
Umbrella – The line remains challenged as nuclear verdicts and social inflation drive larger settlements. Pricing and capacity remain sensitive to class of business, fleet exposure, jurisdiction, and claims history, with upward pressure continuing from underlying auto losses.
The construction sector conditions reflect adjustment rather than acceleration. Residential construction remains constrained by elevated inventory and subdued single-family demand, while nonresidential activity has flattened due to uneven performance across segments. Infrastructure, power, and publicly funded projects continue to provide stability, but overall growth is increasingly concentrated in fewer, higher-value projects.
Large-scale data center development continues to dominate nonresidential starts and backlog, particularly for larger contractors. While these projects support pipeline stability, they introduce heightened complexity tied to electrical systems, specialized equipment, phased construction, and extended timelines. These factors increase execution risk and reinforce the importance of early coordination across project planning, contracts, and insurance placement.
Insurance market conditions remain mixed across construction-related lines. While some pricing stabilization has emerged, underwriting discipline and claims pressure persist—particularly in liability-driven lines. Coverage availability, pricing, and capacity continue to vary based on risk profile, jurisdiction, fleet exposure, and claims history. For large, multi-year projects, careful coordination across general liability, builders’ risk, automobile, and umbrella programs remain critical to maintaining continuity as exposures evolve.
The current environment favors proactive planning and informed risk management. Contractors that engage early on project risk, contract structure, and insurance strategy—and that align coverage, limits, and risk controls with project complexity—will be better positioned to manage uncertainty and navigate ongoing volatility throughout the year.
Amanda Klein
Senior Vice President, Regional Construction Practice Leader
Brian Stockton
Senior Vice President, Regional Construction Practice Leader
Brock Lewark
Vice President, Executive Risk Solutions
Angela Thompson
Marketing Strategist, Market Intelligence & Insights