ConstructionEconomic Overview & Market Update
Q4 2024
This edition covers the construction economy prior to the U.S. Presidential Election in November 2024. The new administration will impact various industry indicators, which will be examined in the next edition.
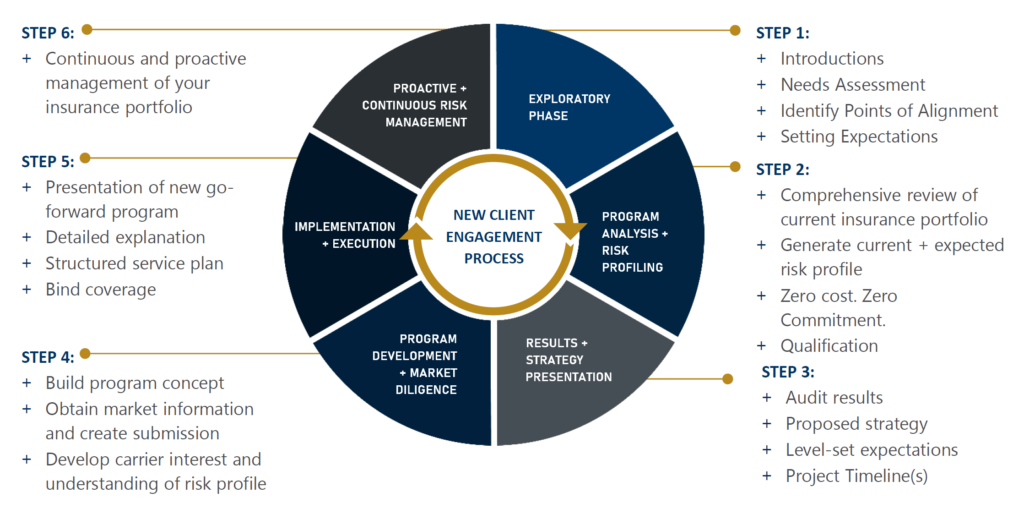
The construction economy comprises several variables that provide a holistic picture of the construction industry. We examine data on variables specific to spending, volume, and starts. Insights on the current state of the construction economy are gathered based on the total spending in different segments relative to volume and actual spending put in place. The current state highlights indicators provide key insights into the future state based on year-over-year trends and relative to monthly changes in the construction economy. The key variables in both the current and future states provide an insight into the overall risks and insurance implications of the construction industry as there is both growth and decline in the industry.
The following data showcases the current state of the construction economy prior to the U.S. Presidential election. We provide analysis of trends in the industry related to jobs, spending, and inflation, as well as actionable insights to help your organization navigate current challenges and make informed decisions for sustainable growth.
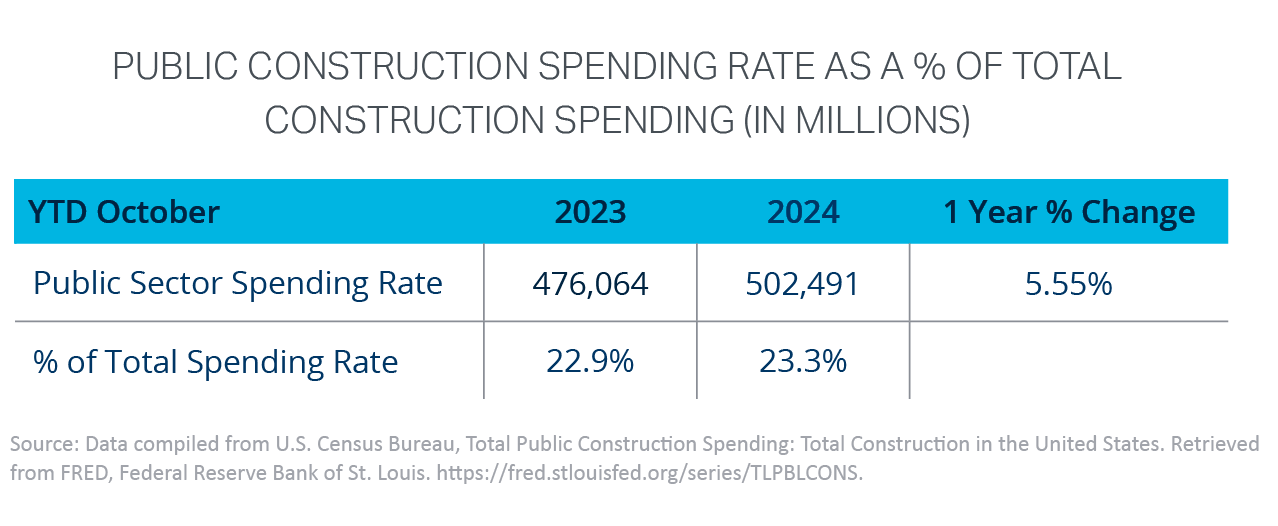
Between October 2022 and October 2023, nonresidential spending increased by 16.6%, totaling approximately $169 billion year-overyear. However, from October 2023 to October 2024, growth slowed significantly, increasing by just 3.9%, with spending increasing by nearly $46 billion year-over-year. By October 2024, leading up to the U.S. presidential election, the spending rate reflected a decline of -0.4% year-over-year, marking the first decrease since July. This trend may indicate that the construction economy is finally stabilizing, having shifted from last year’s 16% growth to a more modest 4% increase this year.
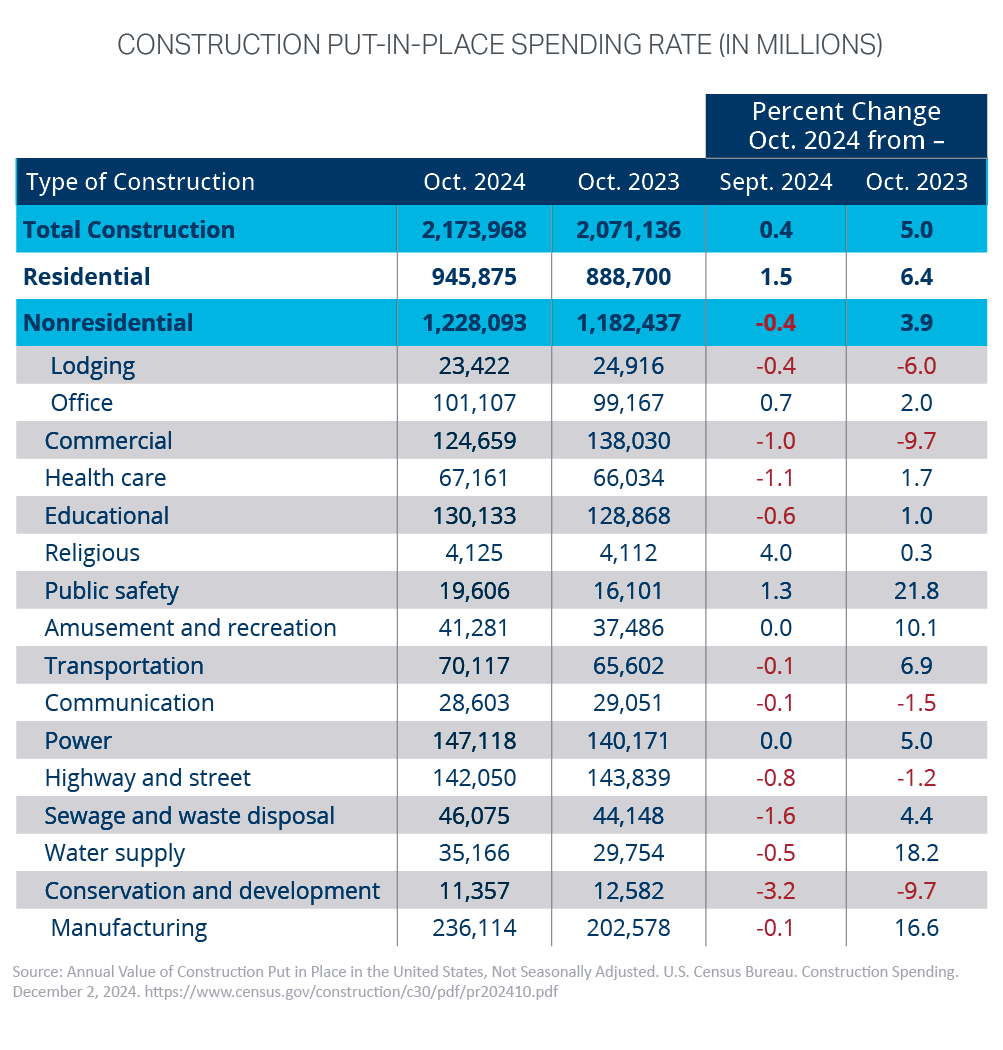
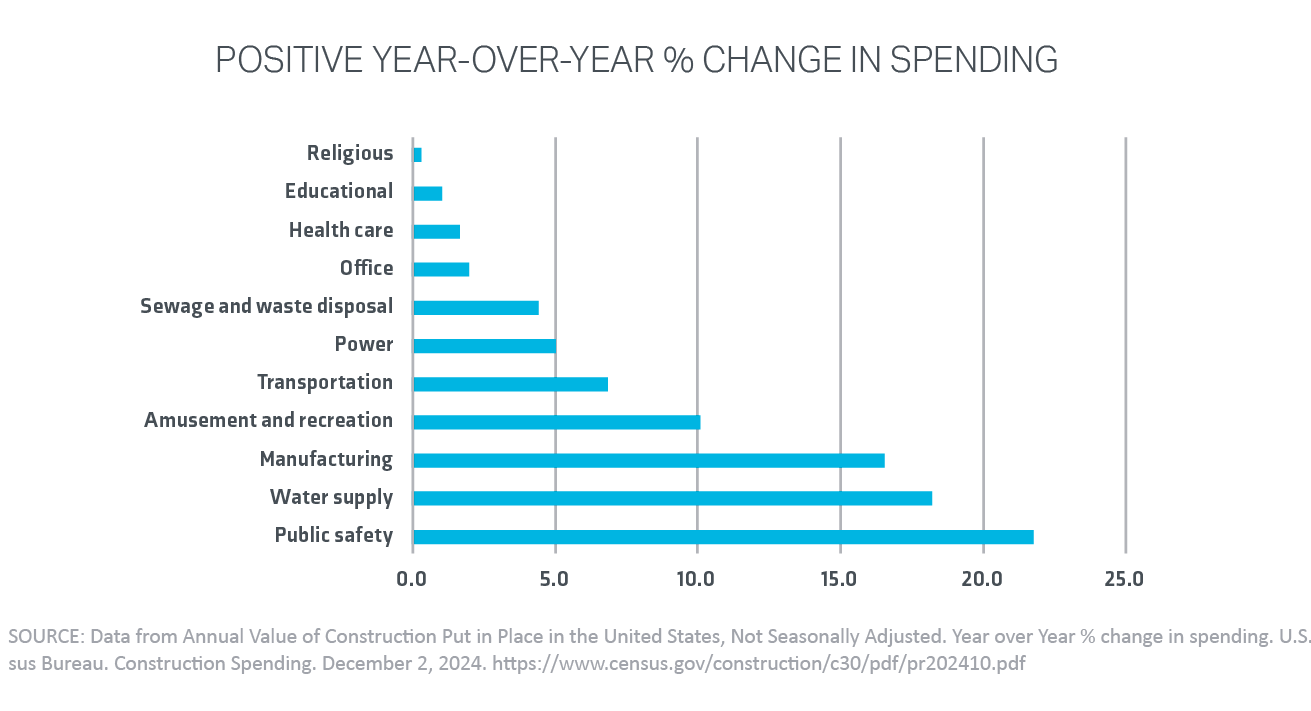
Construction spending was strong in public safety, water, manufacturing, amusement, and recreation, and a few key others reflected in positive year-over-year spending.
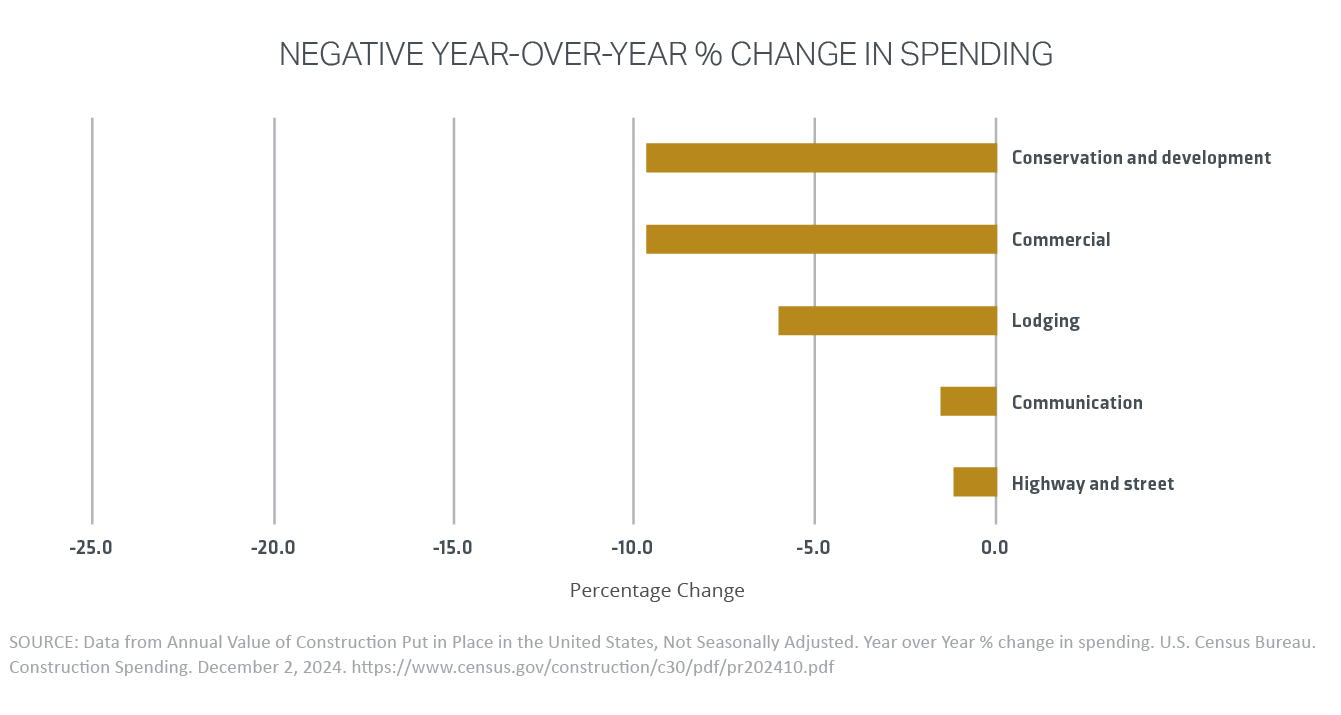
The areas with significant decline in year-over-year spending were conservation and development, commercial, and lodging. This is partly due to the delay in getting jobs online due to permitting and bidding. This is projected to change in 2025 post-election and new administration.
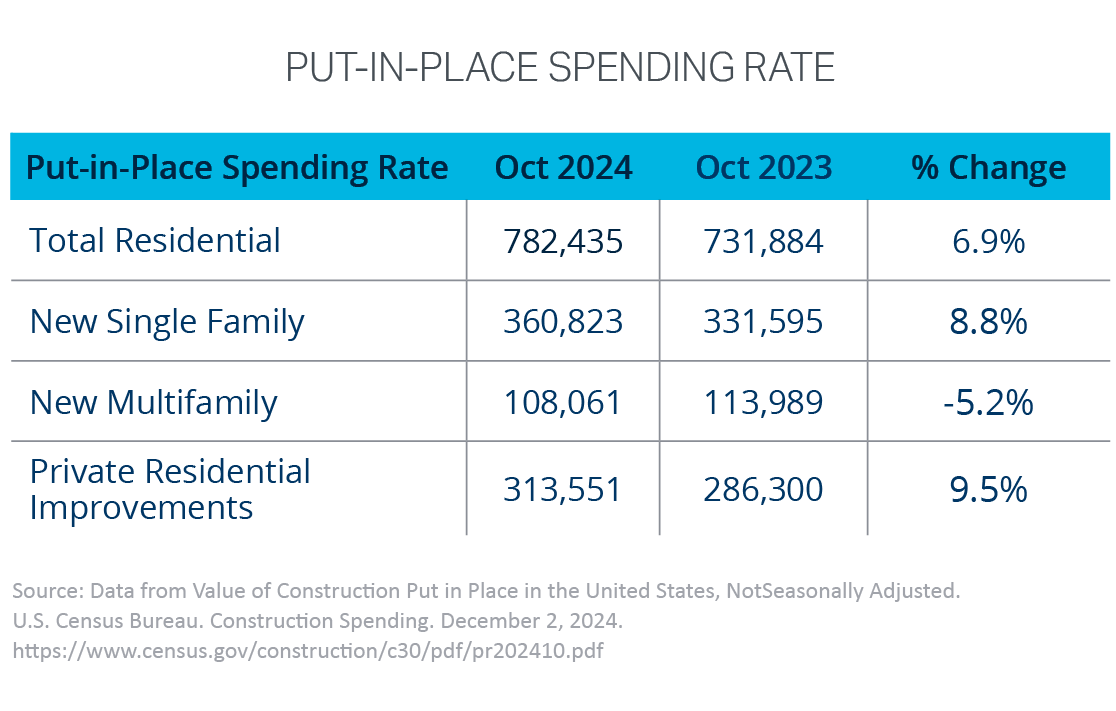
As of October 2024, residential spending increased by 6.9% year-overyear, driven by private residential improvements and new single-family construction. This reflects a strong overall performance in the sector; however, new multifamily spending year-over-year is down 4.3% yearover- year, marking a significant change from the past several months.
Inflation has significantly impacted construction jobs relative to project volume. Overall, contractors chase fewer projects due to fewer jobs being available.
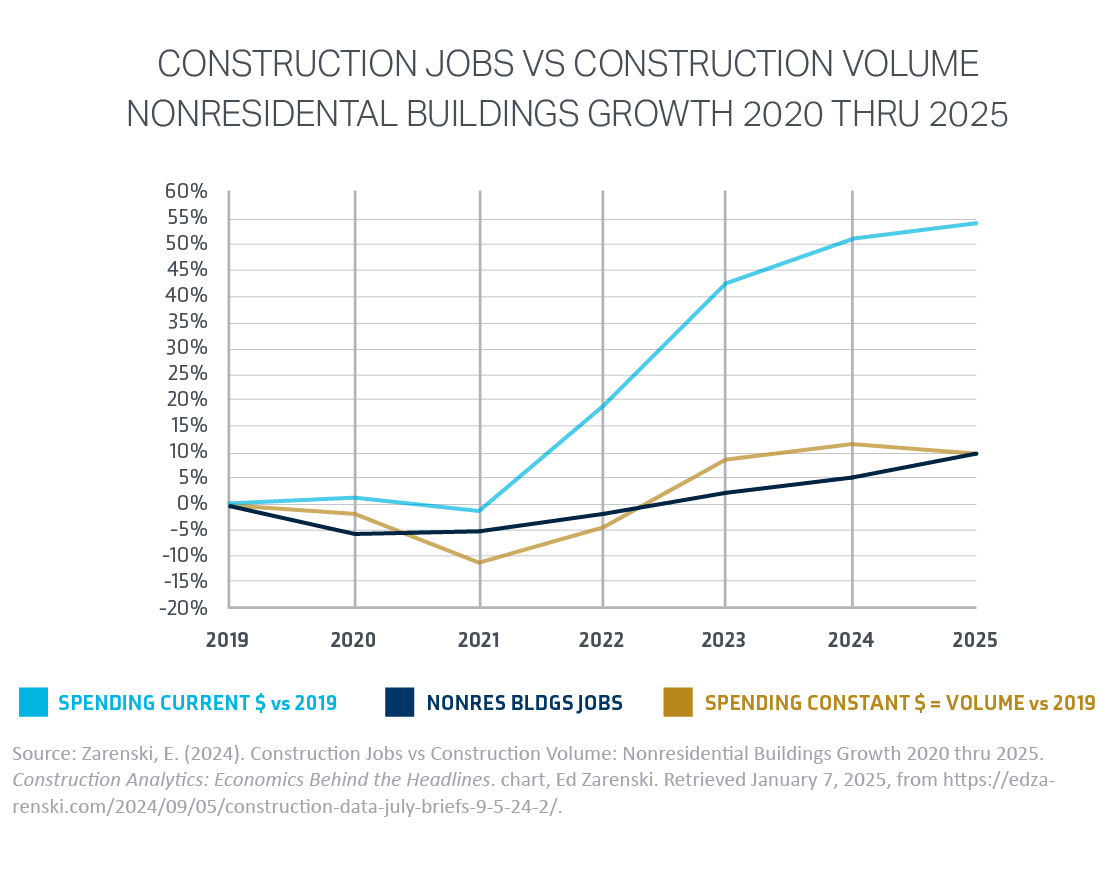
Current spending in today’s dollars is going up due to construction inflation. In addition to that, construction volume has been flat in the last two years, with projects projected to decrease by the end of 2025. Contractors have greater revenue coming in, and the same number of project volumes are projected to decline from the year prior.
The outlook for construction spending in 2025 may differ from trends seen in 2024. In forecasting the future state of the construction economy, key indicators to watch are projects under contract that are set to begin, works in progress, and project owners’ thoughts about future building. If inflation persists, spending may only undergo marginal growth as taxes, tariffs, and labor costs impact all lines of insurance coverage. Labor costs specifically affect workers’ compensation premiums, which saw an overall decline in Q3 2024, according to CIAB.1 Anticipating a construction slowdown may prompt a scaling back of investments, such as hiring people. Current spending reflects the interplay of all these factors.
The Architecture Billings Index (ABI) was negative in December 2023. This was the environment going into 2024. The ABI represents architects asking the following question: are you building more this month than last? If that answer is yes, then it’s positive, and then the second question is: to what degree? Current spending is a function of many past things, including backlog and construction starts, and the ABI is a nine to 12-month leading indicator.
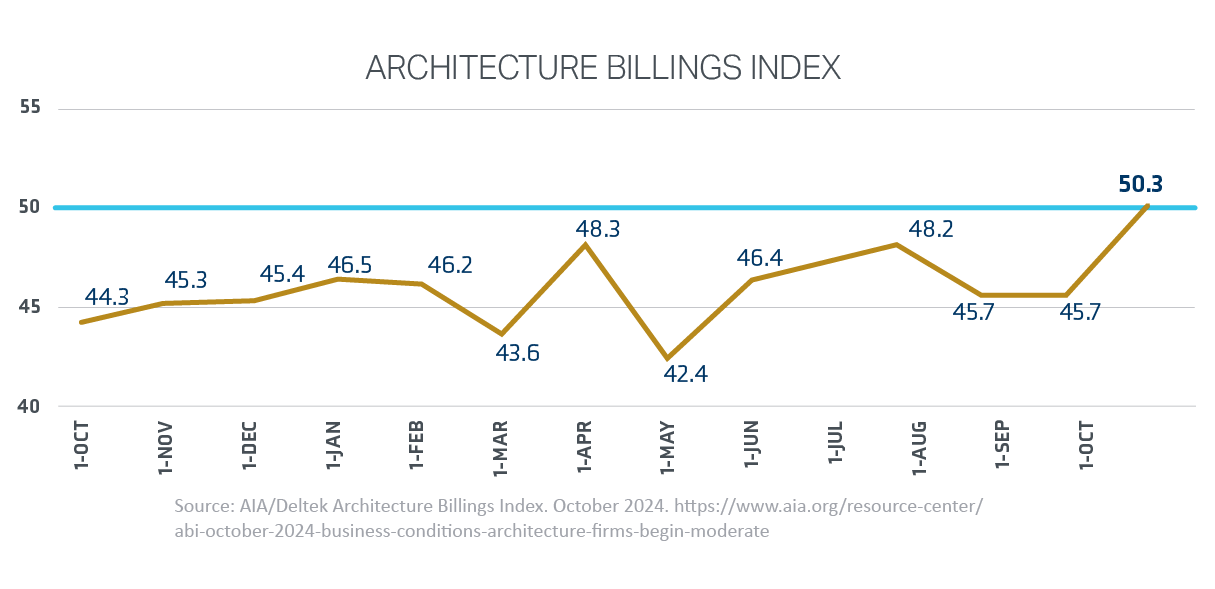
Backlog refers to projects that have been signed up for and are in progress. Current spending is based on construction starts initiated during the year. Notably, spending often increases largely due to the impact of inflation.
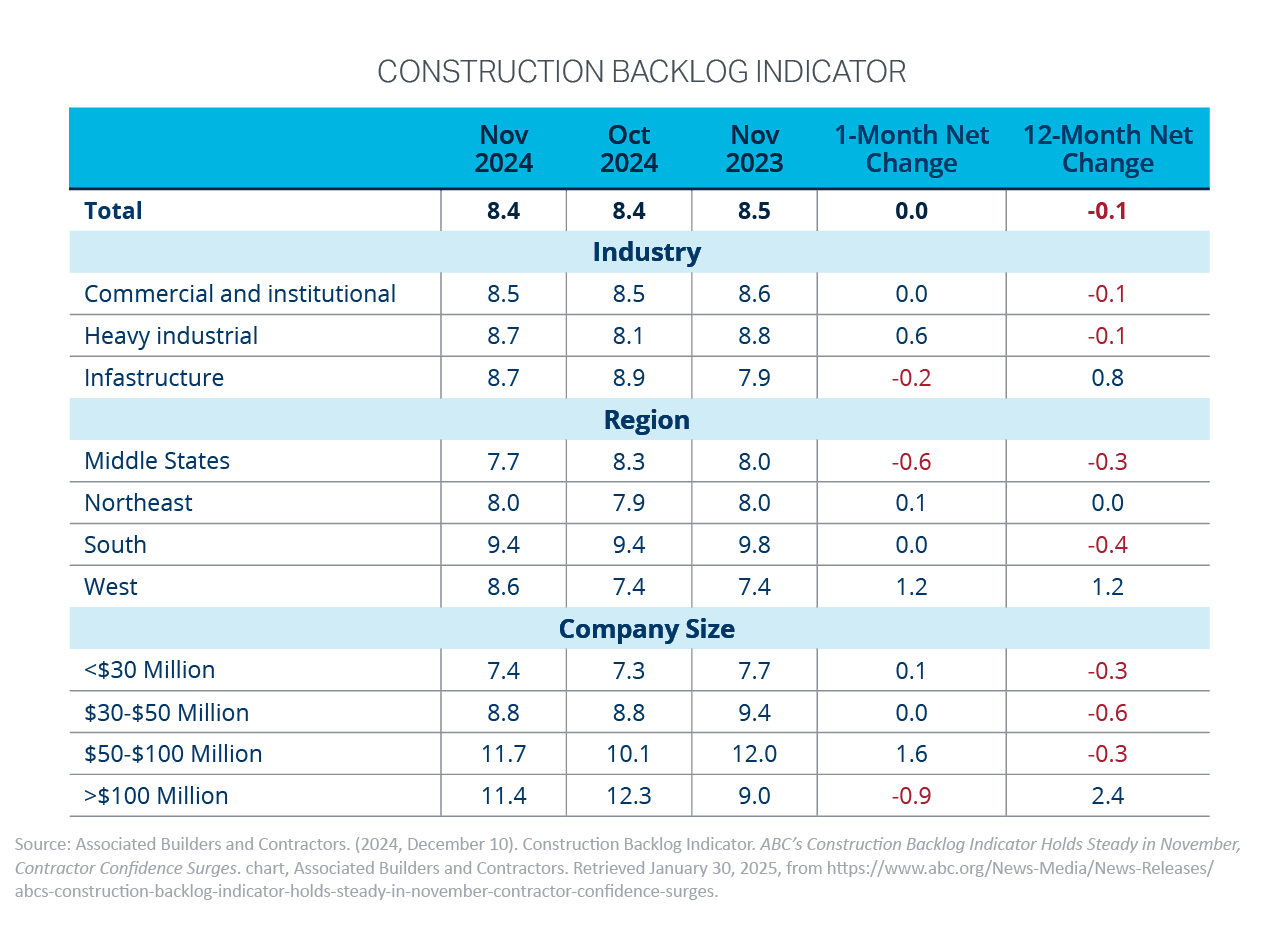
Eight months of the backlog is a good foundation for contractors because it shows jobs are lined up for the future as current jobs reach the final stages, even though it is down slightly from a year ago. It’s still above our 8.0 line of demarcation. The 12-month change by contractors by size is worth noting.
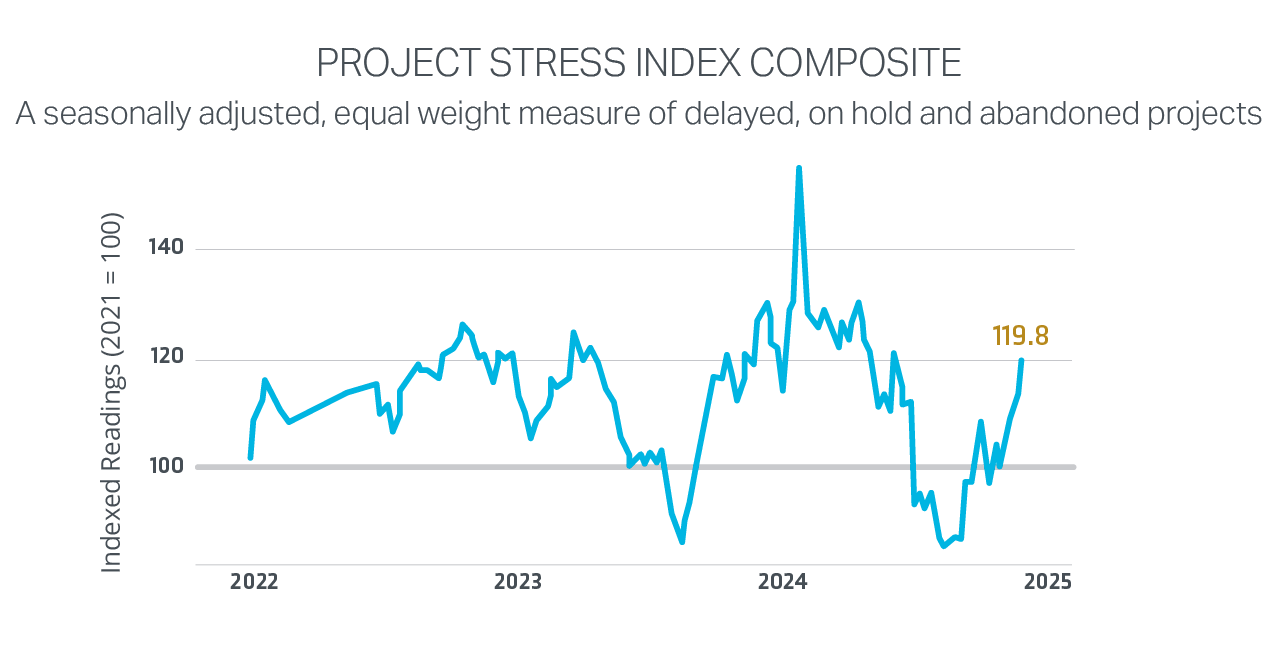
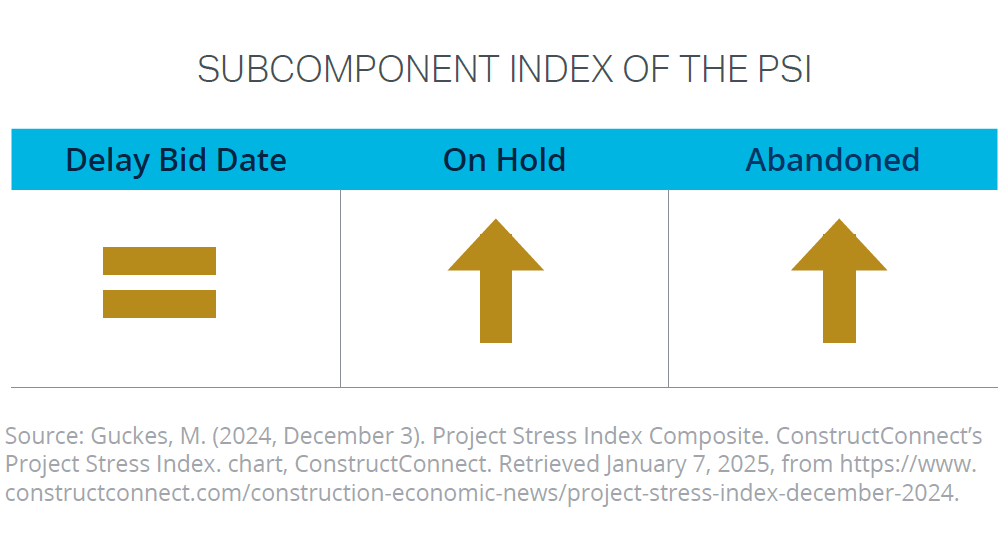
November’s year-over-year project stress index remains in a similar state. The backlog may not be as strong as contractors would like, and as a result, the index is reflected as stressed and determines which jobs will be put on hold or abandoned.
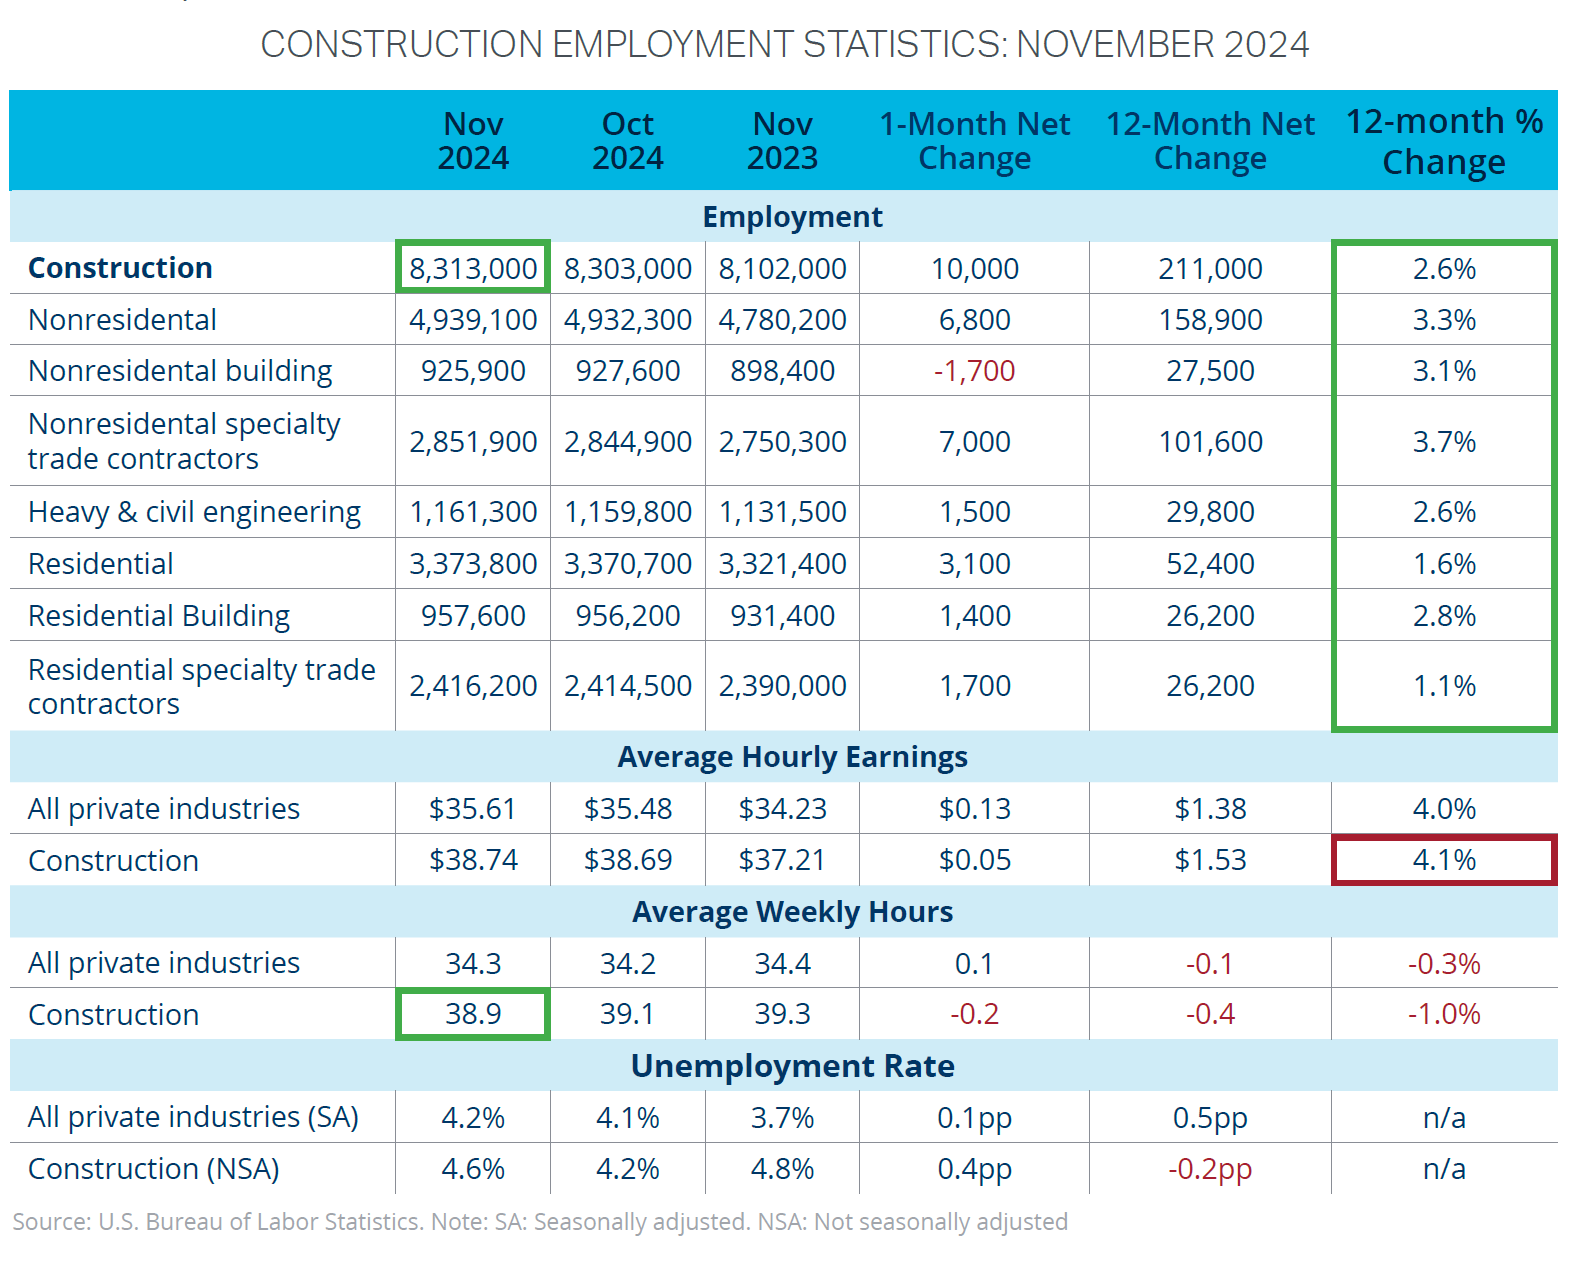
Hourly earnings are up 4.1% year-over-year. This number was around 5%-5.3% prior to the presidential election. The total number of jobs added in November was 10,000, which is close to the 12,000 jobs added in September 2024.
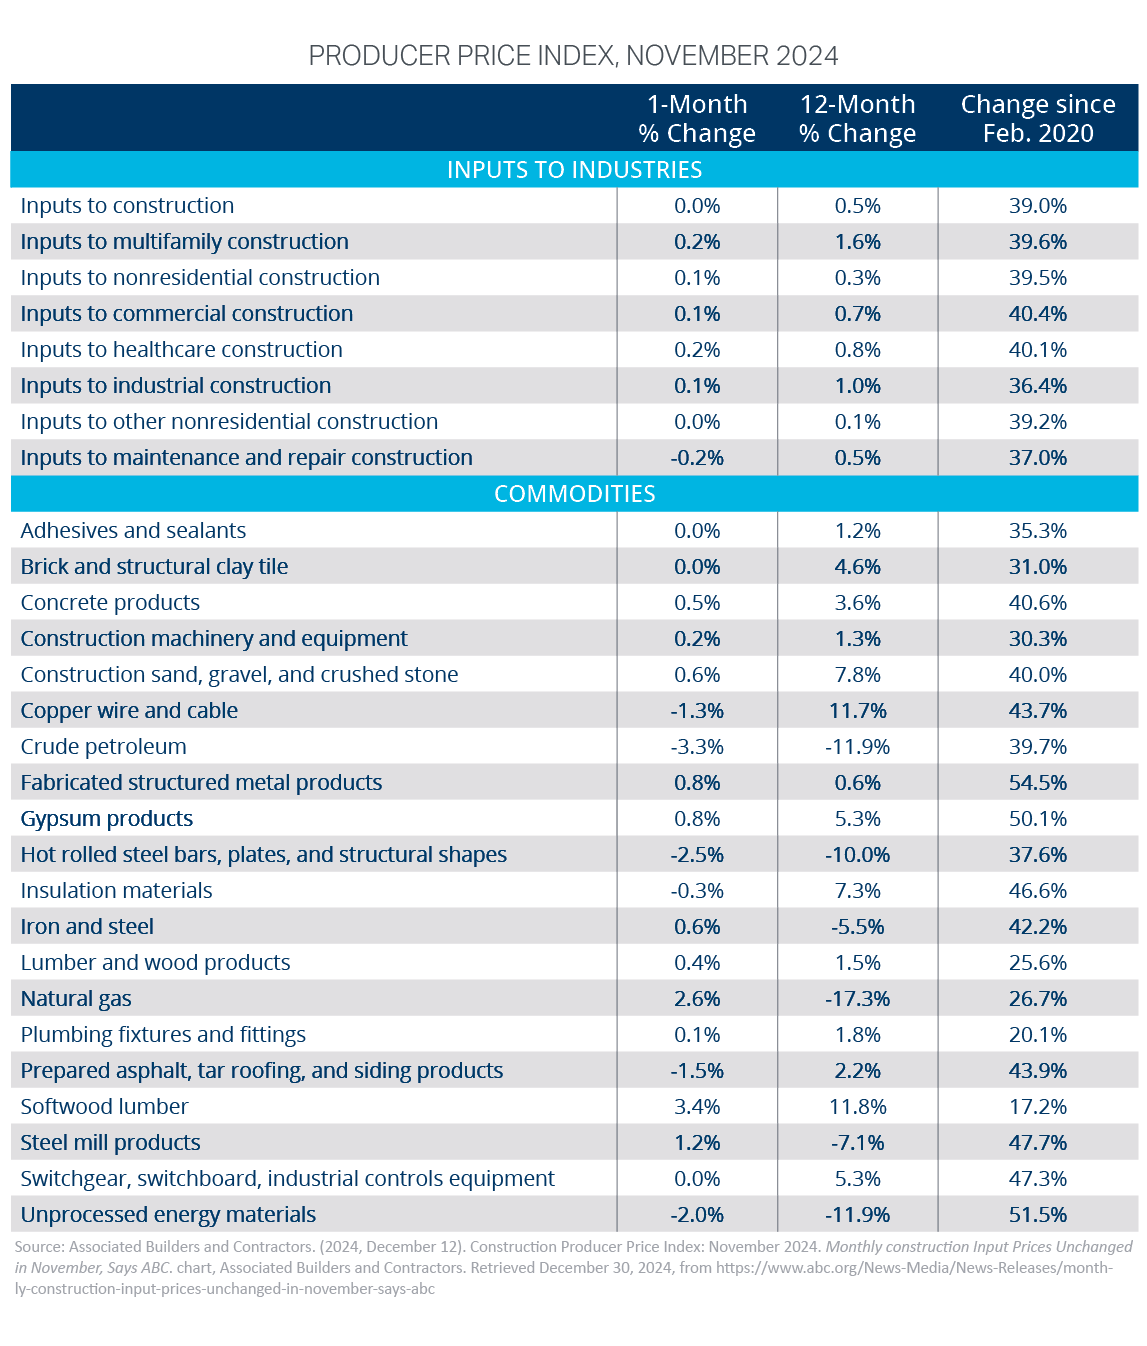
Concrete products and products that go into the concrete will have a higher inflation rate than other products that go into heating. This was part of the demand for all infrastructure. This has driven up the cost of sand, gravel, and stone.
The construction sector is expected to see increased activity in privately financed segments over the next six months, including multifamily projects. However, overall construction growth in 2025 is projected to slow, with total spending for 2024 estimated at $2.179 trillion. With fewer projects to bid on, contractors may seek out-of-state work, impacting insurance considerations, especially in high-risk states like Texas and Florida.
Project costs keep increasing due to inflation. Insurance has been a benefactor of this inflation-driven spending both on payroll and inflation costs. If inflation costs cool, insurance rates will cool as well. Professional liability claims may rise with a growing focus on design-build and alternative project delivery methods. Private equity firms will continue to target contractors, necessitating thorough due diligence. Workers’ compensation tracking for payroll expectations will prioritize hours worked over employee headcount. Meanwhile, builder’s risk insurance will face increased competition and market saturation.
The future state of the construction economy will depend on factors such as upcoming projects, works in progress, and owner sentiment about future building. Persistent inflation, along with taxes, tariffs, and labor costs, may limit construction spending growth and impact insurance coverage. A potential slowdown in construction could lead to reduced investments, including hiring. Current spending reflects these combined influences.
Angela Thompson
Sr. Marketing Specialist, Market Intelligence & Insights