ConstructionEconomic Overview & Market Update
Q4 2023
The IMA National Construction Group gathers to analyze construction economic data, weaving together insights that could influence risk and insurance strategies for construction firms. In specific scenarios, the construction sector thrives even amid a general economic downturn, thanks to the time lag between project initiation and completion, sustaining active spending by owners. Conversely, there are instances where the overall economy is booming, but the construction sector is in decline. The availability and potential of projects for contractors are intricately tied to spending dynamics, with the broader economy influencing owners’ decisions to undertake construction projects.
To get a well-rounded picture of the current state of the construction economy, we look at construction spending, labor, and the cost of construction materials, followed by indicators that will give insight into future expectations. Our future state indicators include backlog, construction starts, ConstructConnect’s Project Stress Index and Expansion Index, and the Architectural Billings Index.
The construction sector thrives even amid a general economic downturn.
We build the Construction Spending Tree, beginning with total construction spending and breaking it into distinct components. It is essential to look at spending in these areas as only some contractors will experience advantages from the overall spending in each area.

The single-family spending rate is positive for the first time in over a year at 5.5%.
Overall, the seasonally adjusted construction spending rate for the United States is up 11.3% for the last 12 months as of November. This is almost double the previous quarter. All sub-components of total construction spending contributed to this increase except for single-family residential. Total spending pushes past the two trillion mark driven by nonresidential spending. For the first time in over a year, all the sectors are up in spending and all green.
Residential construction increased the year-over-year spending rate. Multifamily construction is up with double-digit spending, but the rate has slowed from the blistering 24.6% increase from previous quarters to 13.6% as of November 2023.
The story of single-family construction spending is one of a rebound of sorts. The single-family construction spending rate has been increasing in an irregularly upward line since the recent trough in April 2023. The single-family spending rate is positive for the first time in over a year at 5.5%.
| Residential Spending | November 2023 | November 2022 | Percent Change |
| Total Residential | $896,758 | $865,170 | +3.7% |
| New Single-Family | $422,579 | $400,397 | +5.5% |
| New Multifamily | $135,630 | $119,431 | +13.6% |
Total residential spending may not be seen as improving for contractors. The primary reason for this is found in the put-in-place spending. Put-in-place spending is actual spending without seasonal adjustments and not spending rate. Total residential spending is up 3.7%. This means the spending rate is up, but still needs to be reflected in the actual spending.
The nonresidential spending rate is up 18% year-over-year, which helps to lift the overall total construction spending rate to its 11.3% increase. Overall, spending is up for all categories of nonresidential projects within the various sectors. Manufacturing spending is up significantly compared to other industries.
When looking at the put-in-place spending, actual spending, and not spending rate, we see that every sector of nonresidential spending has been up over the last twelve months as of November 2023.
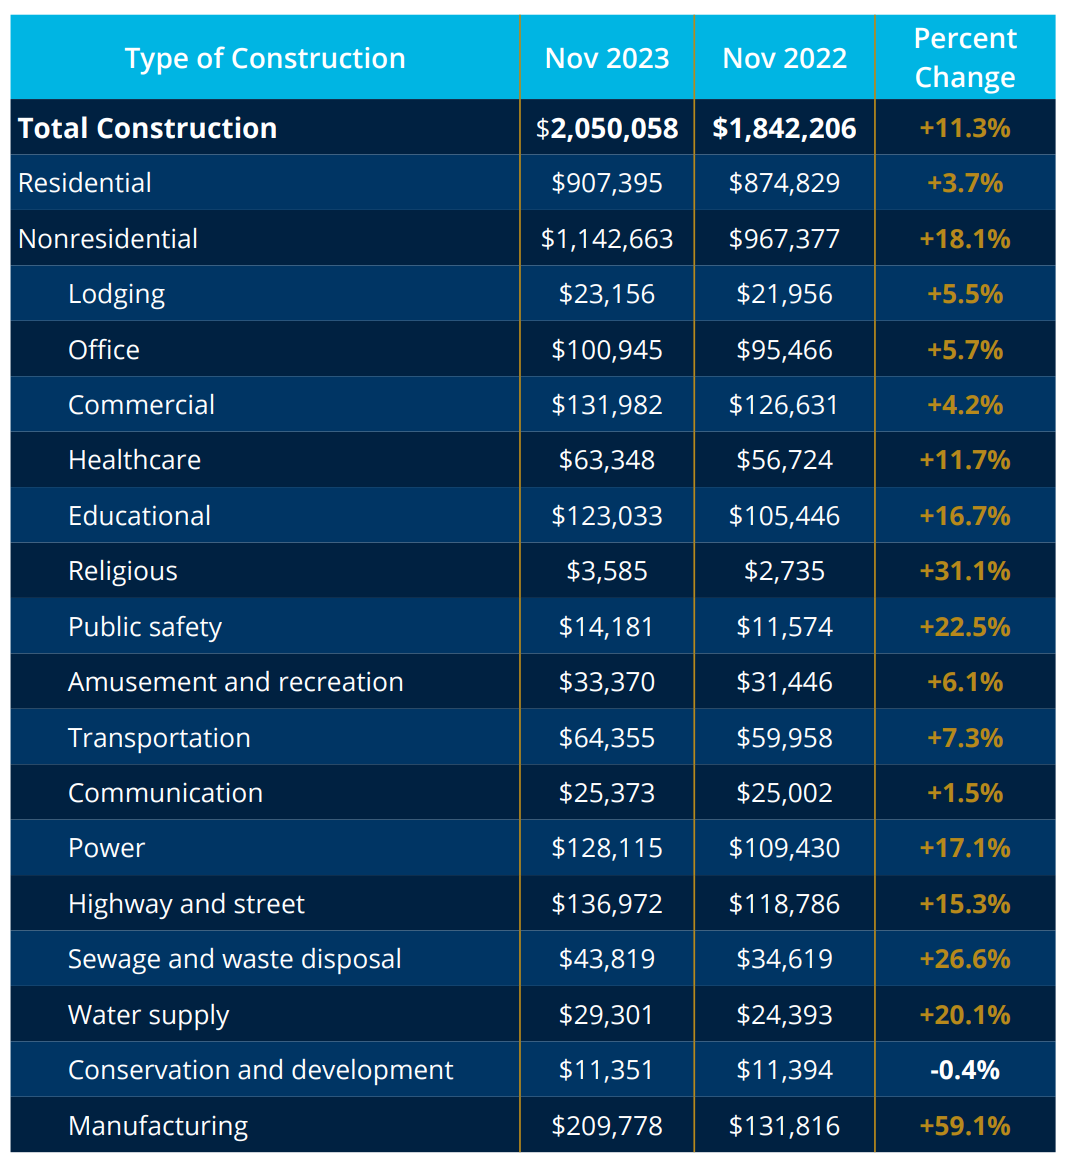
Manufacturing spending is up 59.1% over last year. Some owner industries are spending more on capital projects than others. Contractors who serve owners building manufacturing plants have a lot of work on their hands. Manufacturing spending is a direct result of the U.S. Congress passing the Infrastructure Investment and Jobs Act, CHIPS and Science Act, Bipartisan Infrastructure Law (BIL), and Inflation Reduction Act.
According to the Rhodium Group 2022 report cited in the Center for American Progress written testimony to the U.S. House Oversight and Accountability Committee’s Subcommittee on Health Care and Financial Services, there has been $213 billion of investments to manufacture and deploy clean energy since the passage of the Inflation Reduction Act.1 New investments have supported at least 272 new clean energy projects in 44 states, as documented by Climate Power, including:
The $52 billion CHIPS and Science Act was signed into law in August 2022. The first round of CHIPS Act incentives totaling $39 billion for constructing large-scale fabrication facilities became available in February. As of December 11, 2023, the first CHIPS incentive award of $35 million announced by the Department of Commerce will go to BAE Systems, which makes chips for military aircraft, to increase its production capacity. However, since the signing of the CHIPS and Science Act in 2022, private company investment in American manufacturing has reached $614 billion, according to the White House.2
Public spending rate has increased 16.2% year-over-year. Public spending includes spending by city, county, state, and federal governmental entities. Public spending accounts for 39.8% of total nonresidential construction spending rate.
The government is becoming a more prolific spender on capital improvement projects. Public spending at the federal, state, and municipal levels is increasing.
Even though the public sector spending rate is up 16.2% year-over-year, it is important to note the nonresidential spending rate grew by 19.3%. Public spending has increased substantially in the last 12 months, and other nonresidential spending has increased. The private sector manufacturing spending is a good example of this.
| Nov 2022 | Nov 2023 | Percent Change |
| $391,718 | $455,108 | +16.2% |
Public spending rate has increased 16.2% year-over-year.
There are slightly over 8,000,000 construction workers employed as of November 2023. Employment for nonresidential construction workers is up 3.2% year-over-year, but heavy and civil engineering construction employment is up 5.3% to feed the growing demand fueled by Congressional spending bills.
Wages for construction workers as of November 2023 were up 4.9% over the last 12 months. At the same time, the average weekly hours worked is 39.3 hours, a 2.1% increase from a year ago. This means workers are working longer and being paid more than a year ago.

Higher workers’ compensation premiums for the same number of workers
Overtime Rule Changes
Joint Employer Changes
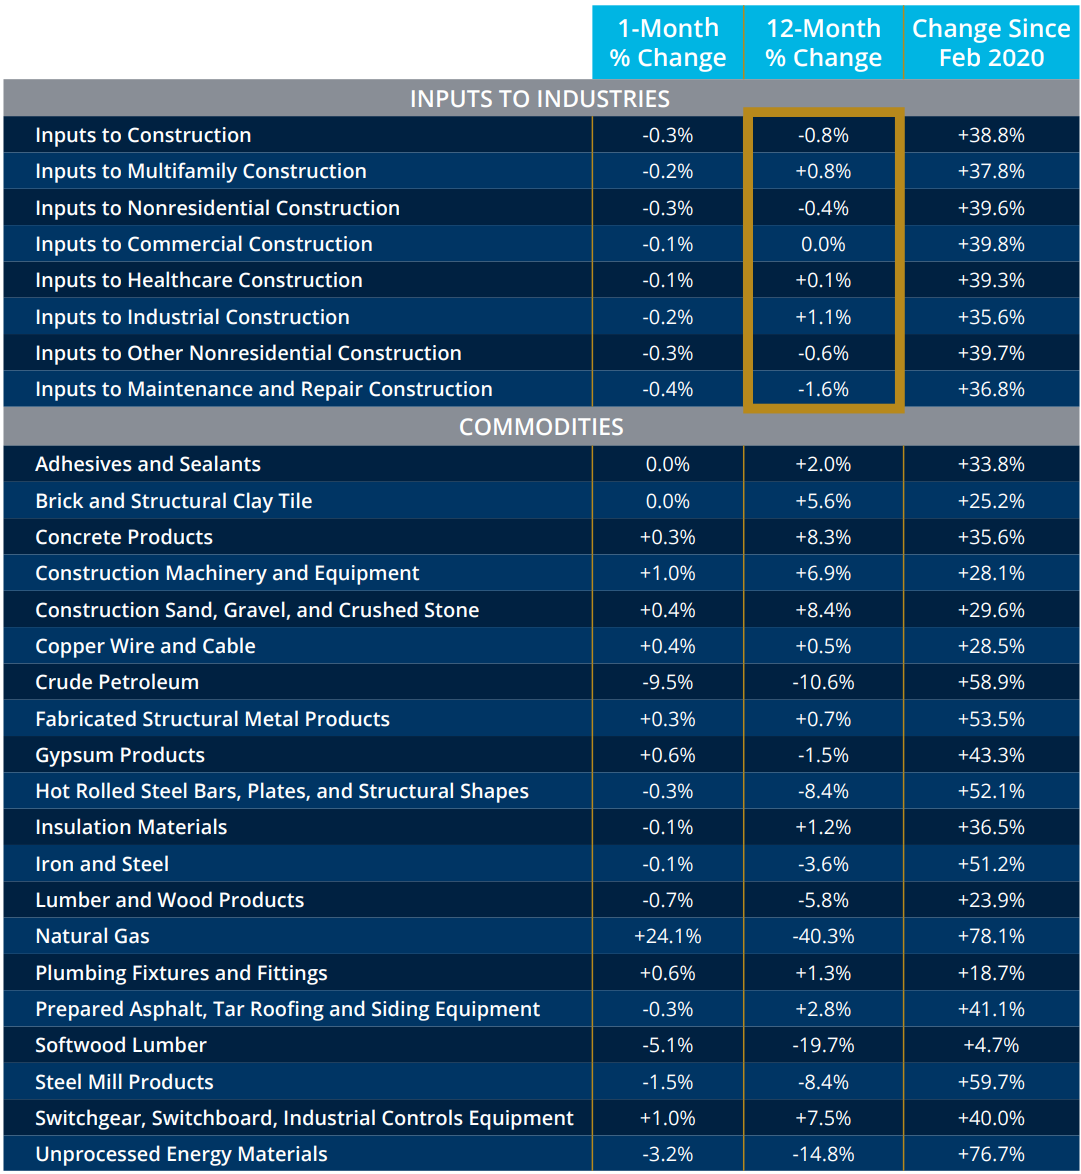
In the last year, the inputs to construction have gone down. These inputs include materials and financing costs, including insurance and labor. Overall, the trend input pricing is coming down.
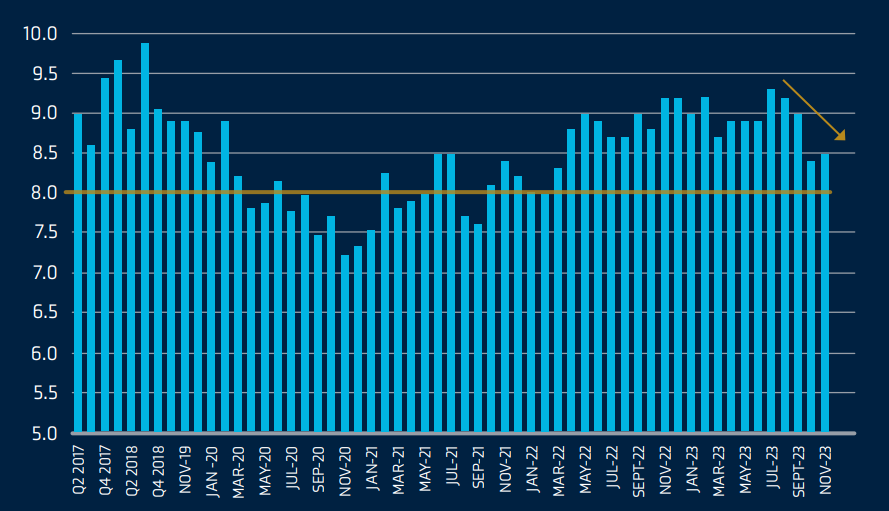
We include backlog in the future rather than the current state because it tells how much work is under contract and still yet to be completed. The Association of Builders and Contractors calculates the figure.
The overall backlog number has decreased -0.7% year-over-year. As of November 2023, the average contractor has approximately 8.5 months’ worth of work under contract to be completed. However, the backlog has begun to fall from its most recent July 2023 high of 9.3 months. This could result from what is happening in the Project Stress Index.
Contractors operating in the $50-$100 million space increased from 10.6 months to 12 months, strengthening their project under contract for the next 12 months. Larger contractors above $100 million had a decrease, which may result from larger projects being completed. Although the figures have flattened, the industry is still at elevated levels.
ConstructConnect has a database of projects, and they have recently created the Project Stress Index. This index gives us insight into the quality of the construction backlog. As of October 2023, the index sits at 132, the second highest only during Covid-19.
Key observations include:
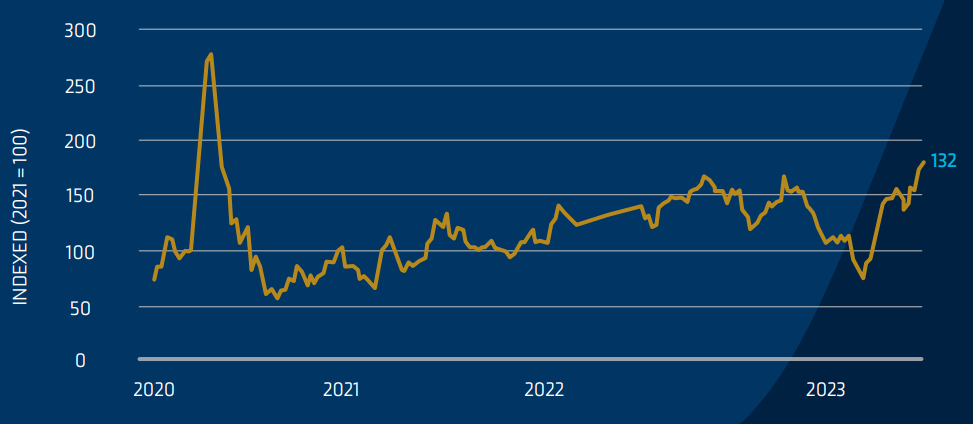
The net result is that backlogs, although still above the eight-month threshold, have been coming down for the past five months simultaneously. The stability of those backlogs executing at the expected time is eroding due to jobs being abandoned or put on hold. Unfortunately, these abandoned or projects on hold reduces the prospects of future spending.
Construction starts refers to the total project value at the project’s start date. The spending curve for each start varies by project type. Construction starts directly correlate to what we can expect in future spending.
In the Trailing Twelve Month (TTM), nonresidential construction starts compared to heavy engineering starts as of November 2023 provides further evidence that future private sector nonresidential construction spending is starting to decrease, while government future spending is increasing.
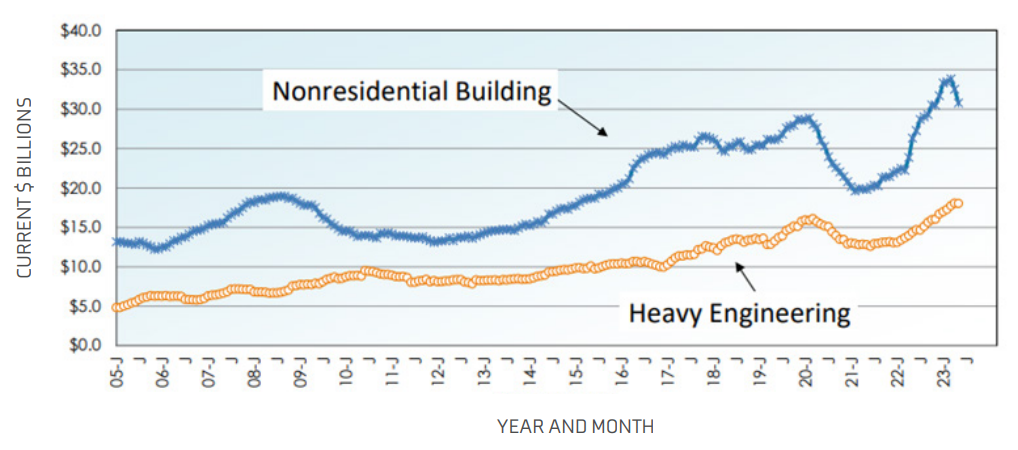
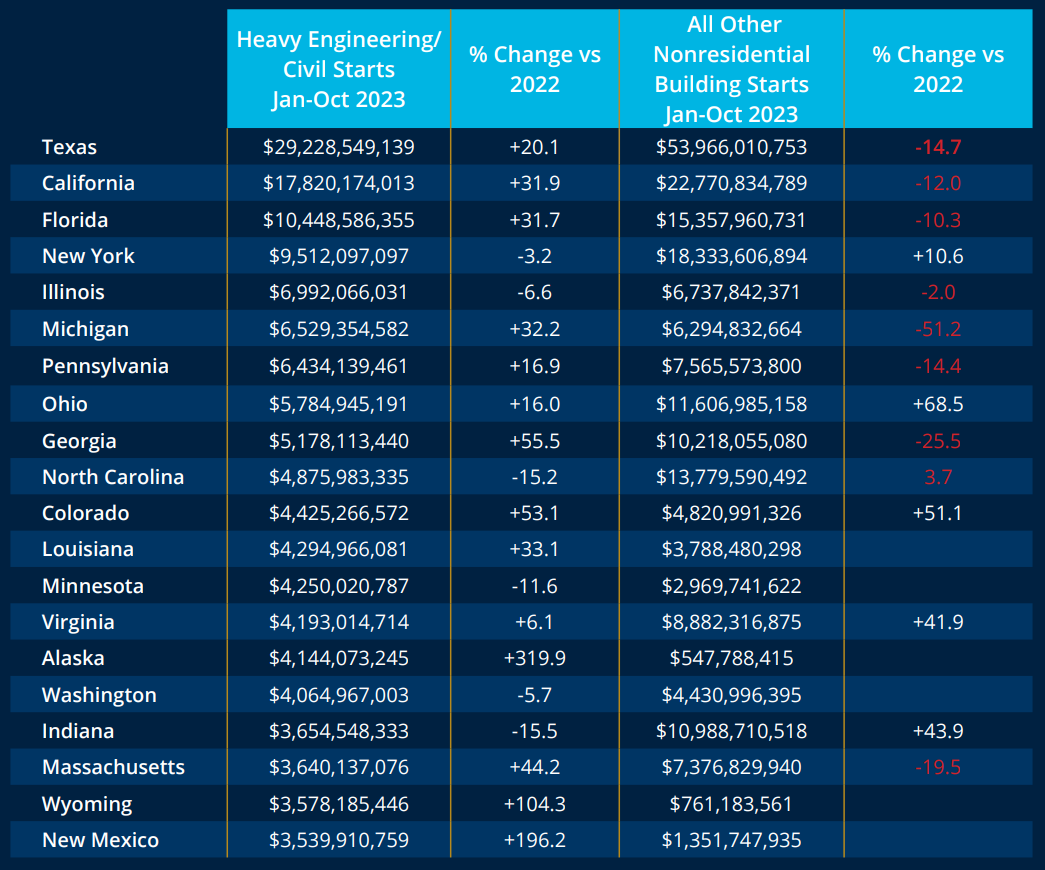
Further evidence of the government’s impact on future spending can be seen in the comparison chart below.
As heavy engineering/civil projects have completion times greater than all other nonresidential building starts, it stands to reason spending from the public sector will continue to be a significant source of construction spending for several years to come for the top-ranked states.
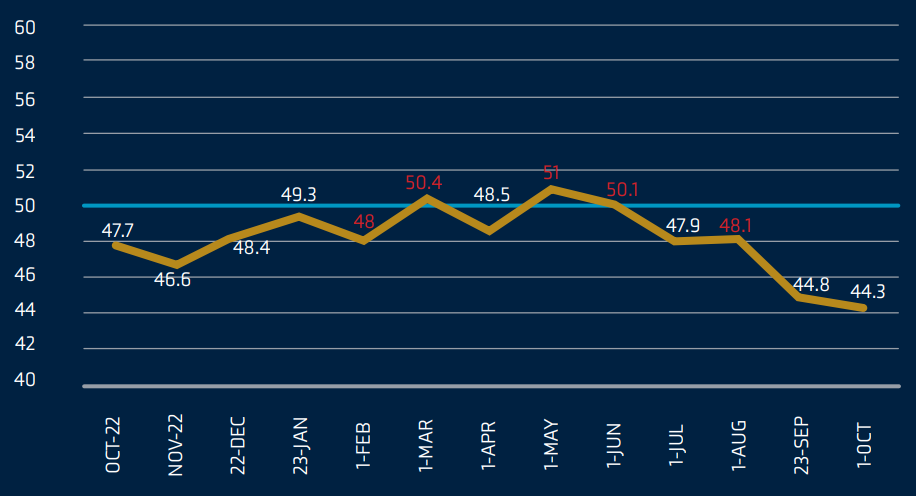
The Architectural Billing Index (ABI) is a leading indicator in the construction industry. The ABI, surveyed by the American Institute of Architects (AIA), measures whether architects are billing more or less than the previous months. If the index is above 50, it indicates growth, while below 50 suggests a decline.
The American Council of Engineering Companies (ACEC) Research Institute publishes a quarterly Engineering Business Sentiment report after surveying each member. Construction plans are produced closer in time to the actual start of construction. Because of this, the survey component of future sentiment provides a shorter leading indicator two quarters (180 days) of future economic activity. This differs from the AIA Architectural Billings Institute, where the design activity is in the pre-construction phase and provides a leading indicator of construction activity by 9-12 months.
In their Engineering Business Sentiment Q4 2023 report, the ACEC Research Institute notes the following future sentiment for the following categories of projects.

There are many organizations that provide their 2024 construction economy outlook. The IMA National Construction Group analyzes no less than five different organizations forecasts. We aggregate input from our design and construction clients to capture our internal forecast, and present two different organizational forecasts to reflect the the divergent views on residential spending.
Our design and construction clients provide us with varying views as to how residential spending will perform in 2024. We believe this is based on differing opinions on what happens to interest rates. We reflect this by comparing construction spending outlooks by Dodge Data & Analytics 2024 and Construction Analytics. Included are the forecast breakdowns below.

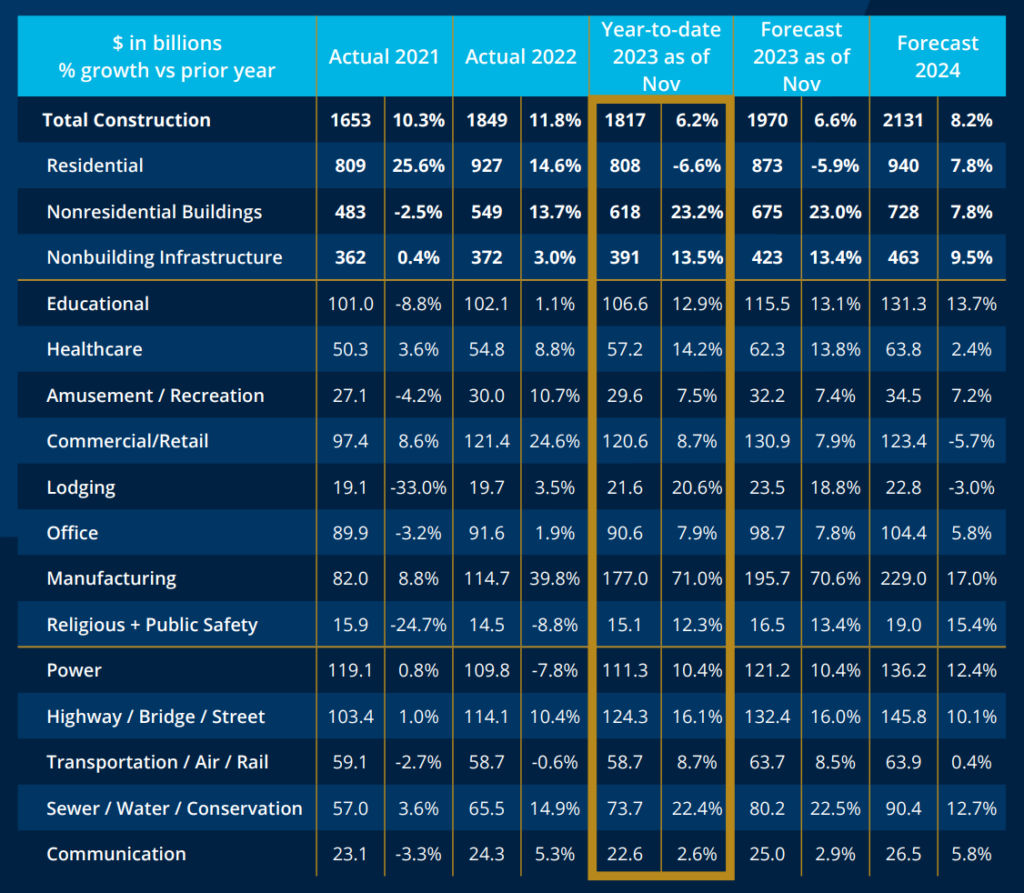
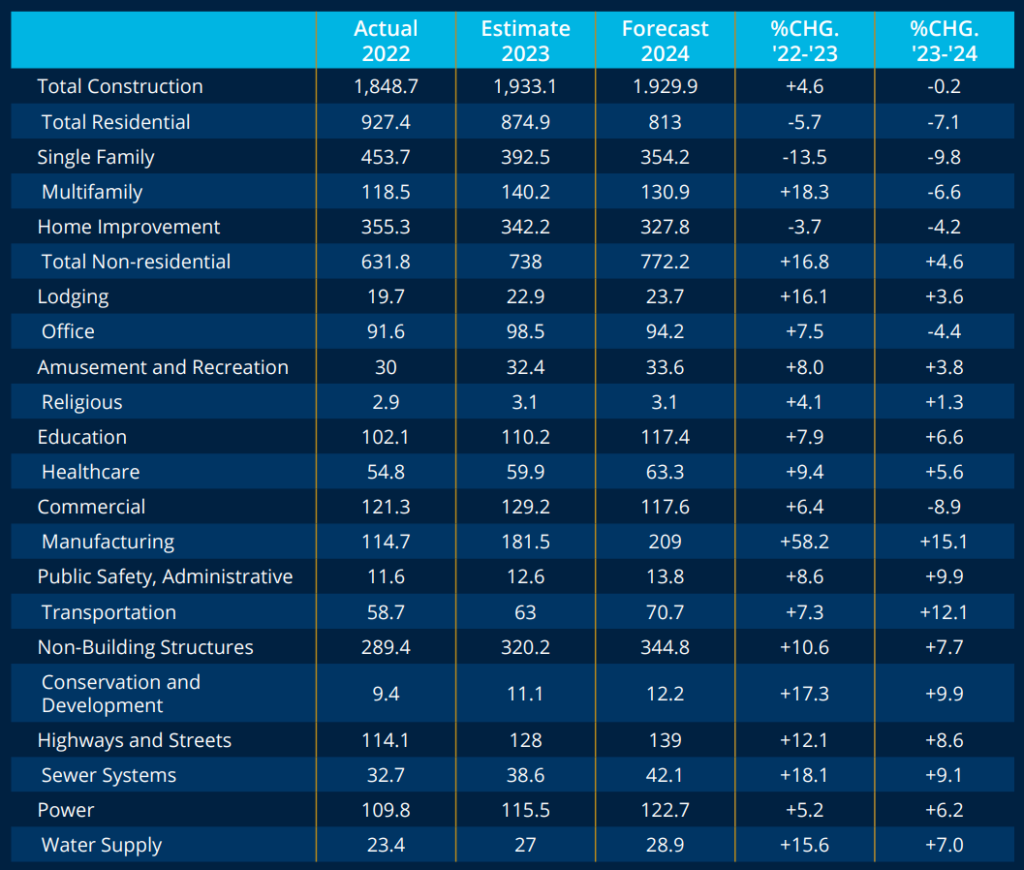
The big question mark for us is multifamily. Multifamily is experiencing continued spending but there are head winds to expect to slow spending in the later part of 2023 and 2024. This is driven by lower architectural billings, higher interest rates on construction loans, higher builders’ risk and property insurance, and uncertainty of regional banks to continue to make commercial loans. In addition, permits for multifamily have been trending downward for the last two years.
In the current construction landscape, overall construction is stabilizing at 10.7%, primarily influenced by a downturn in single-family construction, while nonresidential expenditures across all categories are on the rise, notably with a significant 59.1% increase in manufacturing projects from the previous year. The industry backlog, standing at 8.5 months, according to the Association of Building Contractors. However, ConstructConnect projects stress index suggests backlog is vulnerable to delay in materializing.
Our comprehensive analysis incorporates insights from various organizations, presenting a holistic view of the industry. We highlight the growing public versus private spending. This increase in public spending creates additional areas of risk as federal government agencies implement rules surrounding wages and employer responsibilities. Two organizational forecasts are presented, aligning closely with the sentiments expressed by our clients including the divergent views on residential spending projections for 2024.
Angela Thompson
Sr. Marketing Specialist, Market Intelligence & Insights