ConstructionEconomic Overview & Market Update
Q1 2024
The IMA National Construction Group gathers to analyze construction economic data, weaving together insights that could influence risk and insurance strategies for construction firms. In specific scenarios, the construction sector thrives even amid a general economic downturn, thanks to lag time between project initiation and completion, sustaining active spending by owners. Conversely, there are instances where the overall economy is booming, but the construction sector is in decline. The availability and potential of projects for contractors are intricately tied to spending dynamics, with the broader economy influencing owners’ decisions to undertake construction projects.
To get a well-rounded picture of the current state of the construction economy, we look at construction spending, labor, and the cost of construction materials, followed by indicators that will give insight into future expectations. Our future state indicators include backlog, construction starts, ConstructConnect’s Project Stress Index and Expansion Index, and the Architectural Billings Index.
We will use the available information to form a picture of the environment and provide insights into the risks and insurance implications.
The construction sector thrives even amid a general economic downturn.
We build the Construction Spending Tree, beginning with total construction spending and breaking it into distinct components. It is essential to look at spending in these areas as only some contractors will experience advantages from the overall spending in each region.

Total Construction Spending Rate in all sectors is up year-over-year. The nonresidential spending rate is up 20%, and the Residential spending rate is up 6.8%. It is essential to note the spending we see today is because something was previously planned, designed, bid, assigned, and started.
The nonresidential spending rate is up 20% and the residential spending rate is up 6.8%.
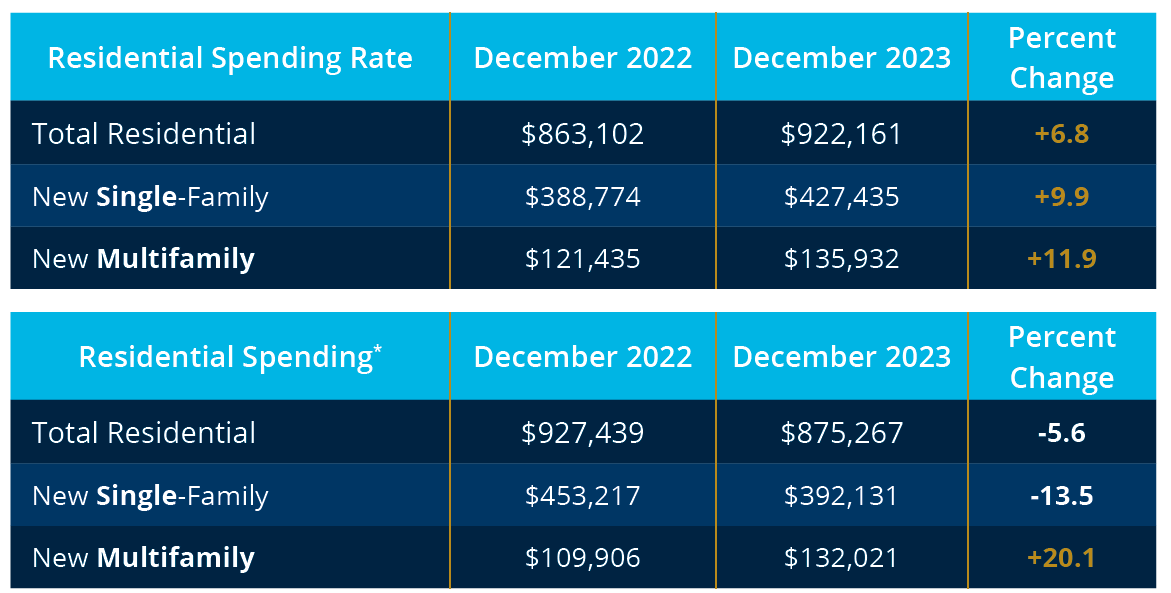
Total residential spending for December 2023 is up 6.8%, with multifamily continually driving the overall residential spending numbers, accounting for 11.9% of the change in the sector—the single- family spending rate ended in 2023, up 9.9% higher than last year. Investors are a big driver for single- family residential spending in the Build-to-Rent space and Townhomes.
Build-to-rent homes are built and held by the owner solely for rental purposes. The National Association of Home Builders (NAHB) estimates that for the last 12 months, 8% of all single-family homes were buildto-rent homes. The NAHB estimates another 5% of single-family homes are built and sold to another party for rental purposes.
It may be too early to call it a trend, but it is important to bring a builder’s risk contractual scenario to our attention so that contractors can be aware of a potential problem before it is too late. Two notable scenarios have presented themselves in the last quarter.
It is understood that a builder’s risk policy typically does not cover subcontractors’ tools and equipment. However, it is also understood that builder’s risk policies typically cover materials that will become a permanent part of the structure before they have been incorporated into the structure. Many, if not most, builder’s risk policies have additional coverage with sublimits for those materials while they are in transit or at temporary locations.
The owner/contractor builder’s risk policy defined Additional Insureds (subcontractors) with language tying it back to the contract language. The builder’s risk policy is insured almost solely for the owner’s benefit, leaving the subcontractor without coverage on this project. Had the subcontractor noticed the clause and could not negotiate coverage under the owner/contractor builder’s risk coverage, a separate installation coverage could have been arranged for the subcontractor’s interest.
In this case, the builder’s risk policy would have responded for materials not incorporated into the structure but then would have subrogated (sought reimbursement) from the contractor. The net result would have been the same as the first example in that the contractor would be responsible for damage to the materials until they become part of the structure.
Again, we cannot say this is a trend in owner-related construction contracts. At the very least, it heightens the importance of reviewing the insurance requirements closely to ensure the builder’s risk coverage will protect you from the materials that will become part of the permanent structure before they are incorporated or accepted by the owner.
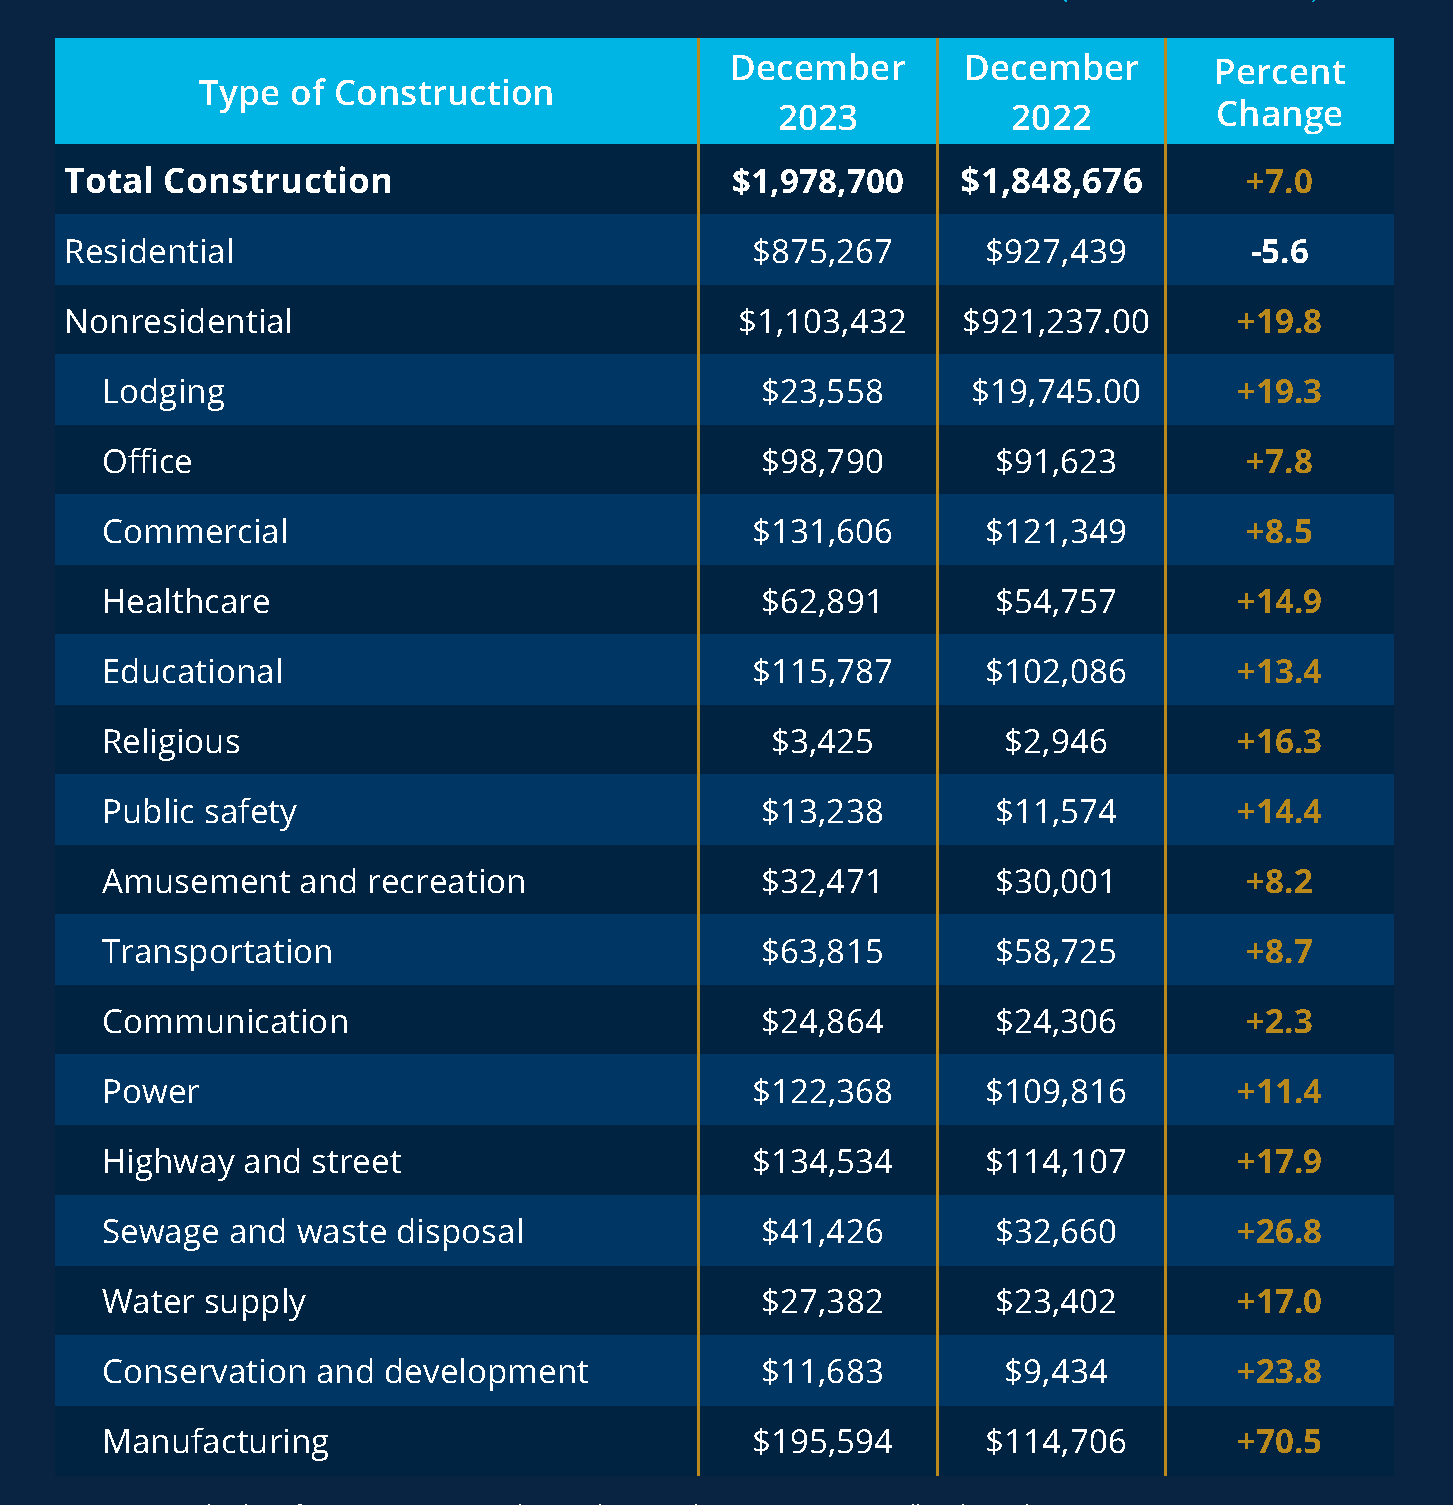
The nonresidential spending rate is up 20.1% year-over-year, with the Put-in-Place spending close behind ending December 2023 up 19.8% compared to the same period in 2022. Actual spending in all the non-residential project types experienced an increase compared to 2022. Of the 16 project spending categories, 12 enjoyed double-digit spending growth over last year. Manufacturing spending ended up 70% higher than last year, driven by the continued release of funds authorized by federal spending bills.
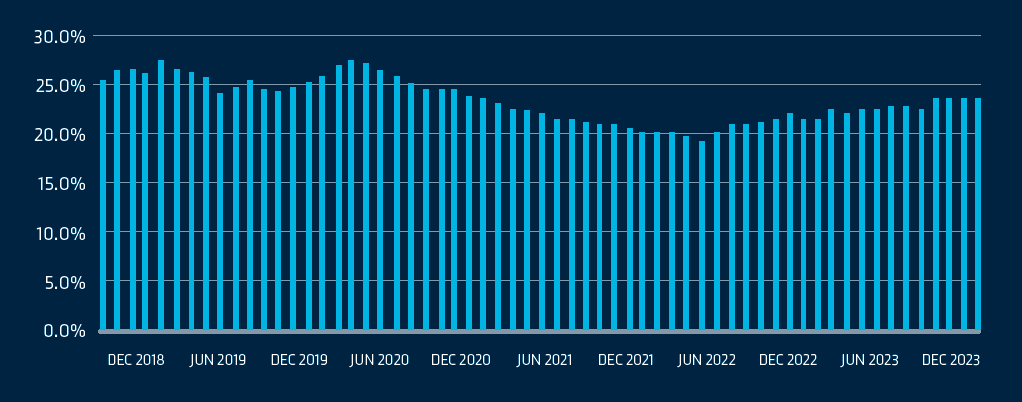
Over the past ten years, public spending has historically averaged 23.8% of total construction spending. Since March of 2022, the public spending rate has consecutively increased from 19.9% to where, as of January, it accounts for 22.7% of all construction spending. It is challenging to quantify if the spending is being driven more by the federal government versus local and state spending. The challenge is present because many of the 2022 federal spending bills include incentives to the private sector and shared grants to state and local governments.
The public spending rate at the end of December 2023 was up 21.3% year after year. This is a significant one-year increase for a sector that traditionally spends in a narrow and gradual range.
| December 2022 | December 2023 | One Year Percent Change |
| $392,570 | $476,326 | +21.3% |
Public spending rate has increased 21.3% over one year.
We highlighted the Davis- Bacon Act and the Project Labor Agreement rule changes in our IMA Q4 2023 Markets in Focus
A contractor can be deemed a joint employer if the contractor possesses the authority to control at least one of the seven enumerated essential terms and conditions of employment, regardless of whether that control is exercised. As contractors seek legal advice on how best to navigate the rule, one tactic that has been raised is to clarify contractual language (and back it up in day-to-day activities), limiting the responsibility a contractor has for subcontractor employees.
Unfortunately, the seventh condition reads, “Working conditions related to the safety and health of employees.” A general contractor is responsible for maintaining a safe work site and overseeing subcontractors do the same for their employees. General contractors will be in an almost untenable situation of trying to avoid being deemed a joint employer while simultaneously fulfilling the responsibility of running a safe work environment. Depending on the degree contractors lean to the side of working to avoid being deemed a joint employer, job site safety could be negatively impacted. This is not good for the individual worker and raises the risk of increased frequency of OSHA inspections and fines.
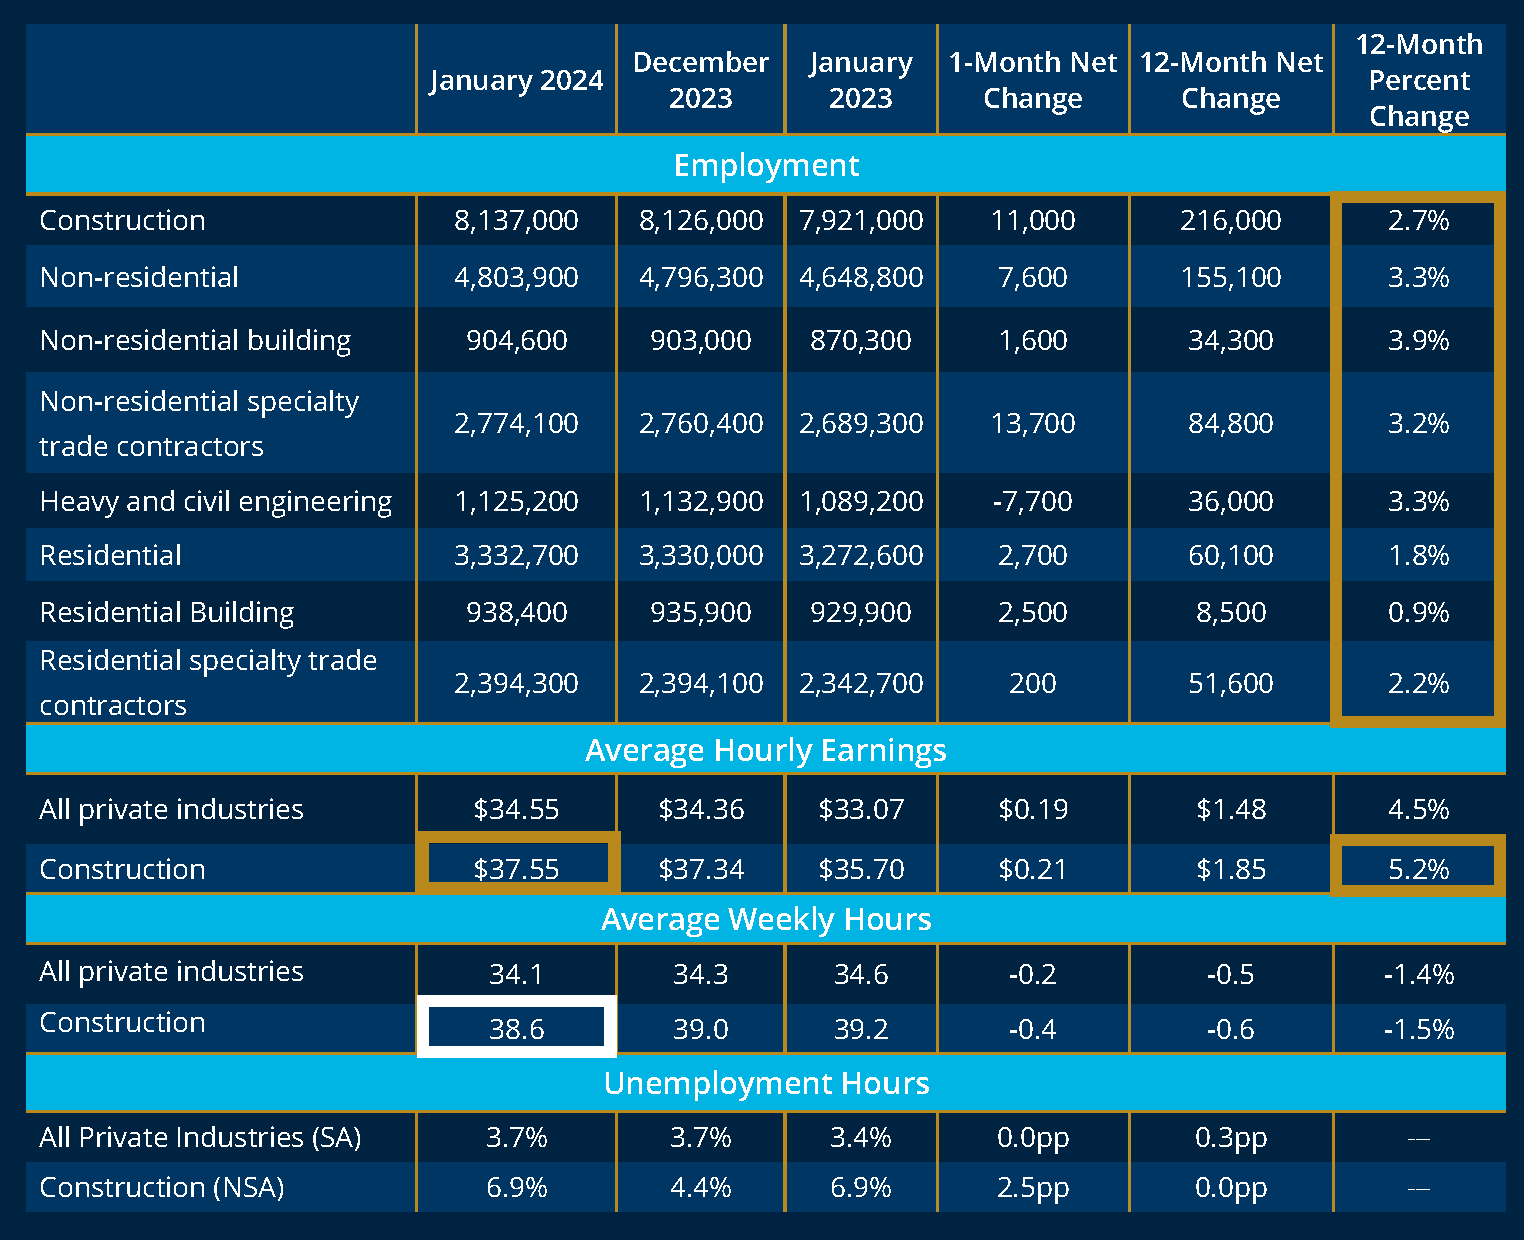
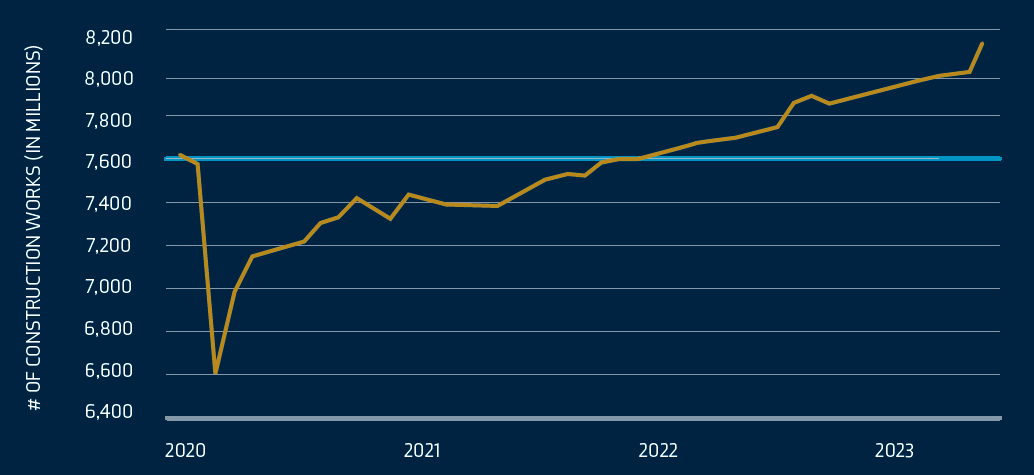
At the end of 2023, an all-time high of 8.126 million construction workers were employed, with another 11,000 added to that total in January 2024. At the same time, there were 374,000 construction job openings after hiring 227,000 workers at the end of 2023. In response to the need to attract workers, average construction wages have increased by 5.2% over the last year.
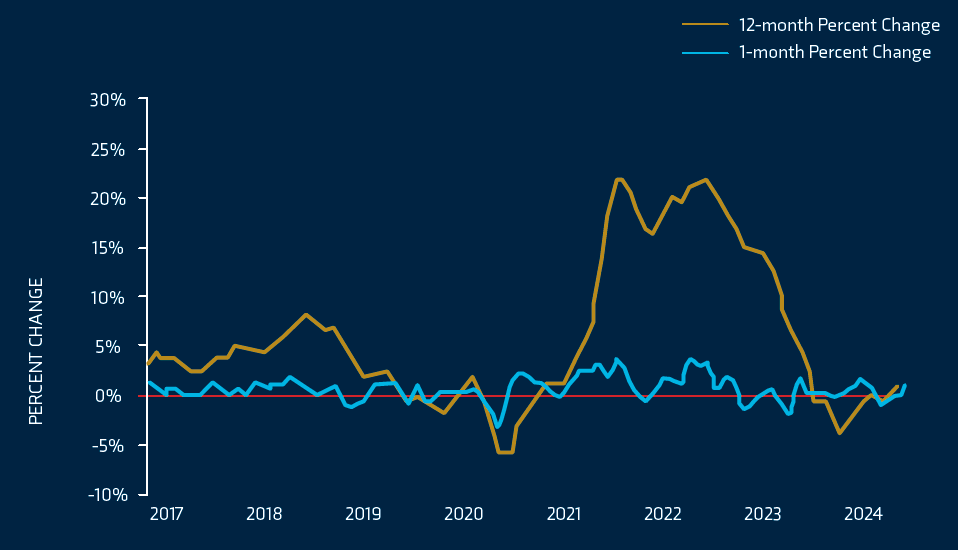
For most of 2023, construction material price increases remained relatively flat, precipitously bringing down the 12 month moving average for prices overall. During the AGC Surety and Risk Managers 2024 Conference, Ken Simonsen, Chief Economist for the Association of General Contractors, noted prices for concrete products and aggregates have risen in the past month and 12 months, contrary to the overall materials pricing trend. This could result from the Bipartisan Infrastructure Act passed by the federal government.
| Material | 1-month Change | 12- month Change |
| Concrete Products | 0.8% | 6.2% |
| Construction sand, grave, and crushed stone | 3.3% | 8.1% |
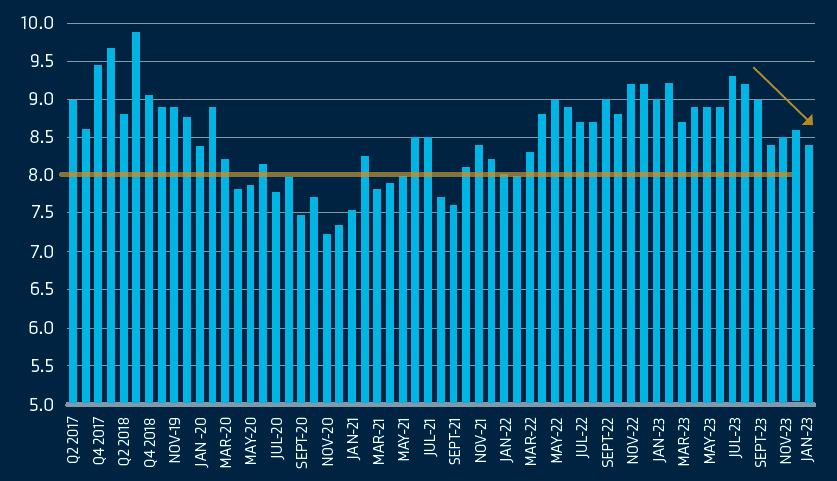
The Associated Builders and Contractors calculates the figure for the Construction Backlog Indicator (CBI), which attempts to measure the work in backlog or growth in the value of work on the contractor’s books. It measures the current month of the total remaining value of projects in backlog divided by the previous 12 months’ total revenues, times 12. The backlog increases if new starts are greater than spending during the year.
Backlogs have slipped from the prior month and year and are on a 7-month decline trend. Industrial contractors’ backlog has bucked this trend, while the larger the contractor, the more months of backlog they enjoy on their books.
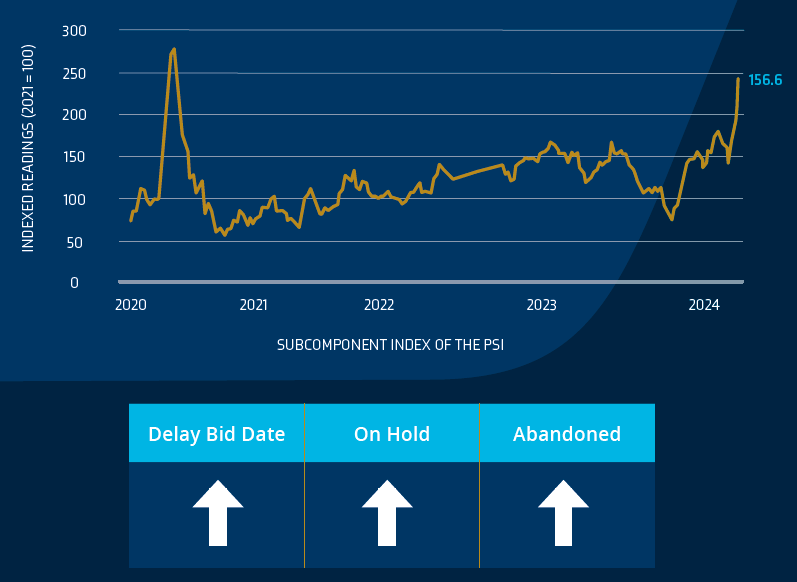
ConstructConnect has a database of projects, and they have recently created the Project Stress Index. This index gives insight into the quality and stability of the construction backlog.
Key observations include:
Construction starts refers to the total project value at the project’s start date. The spending curve for each start varies by project type. Construction starts directly correlate to what we can expect in future spending.
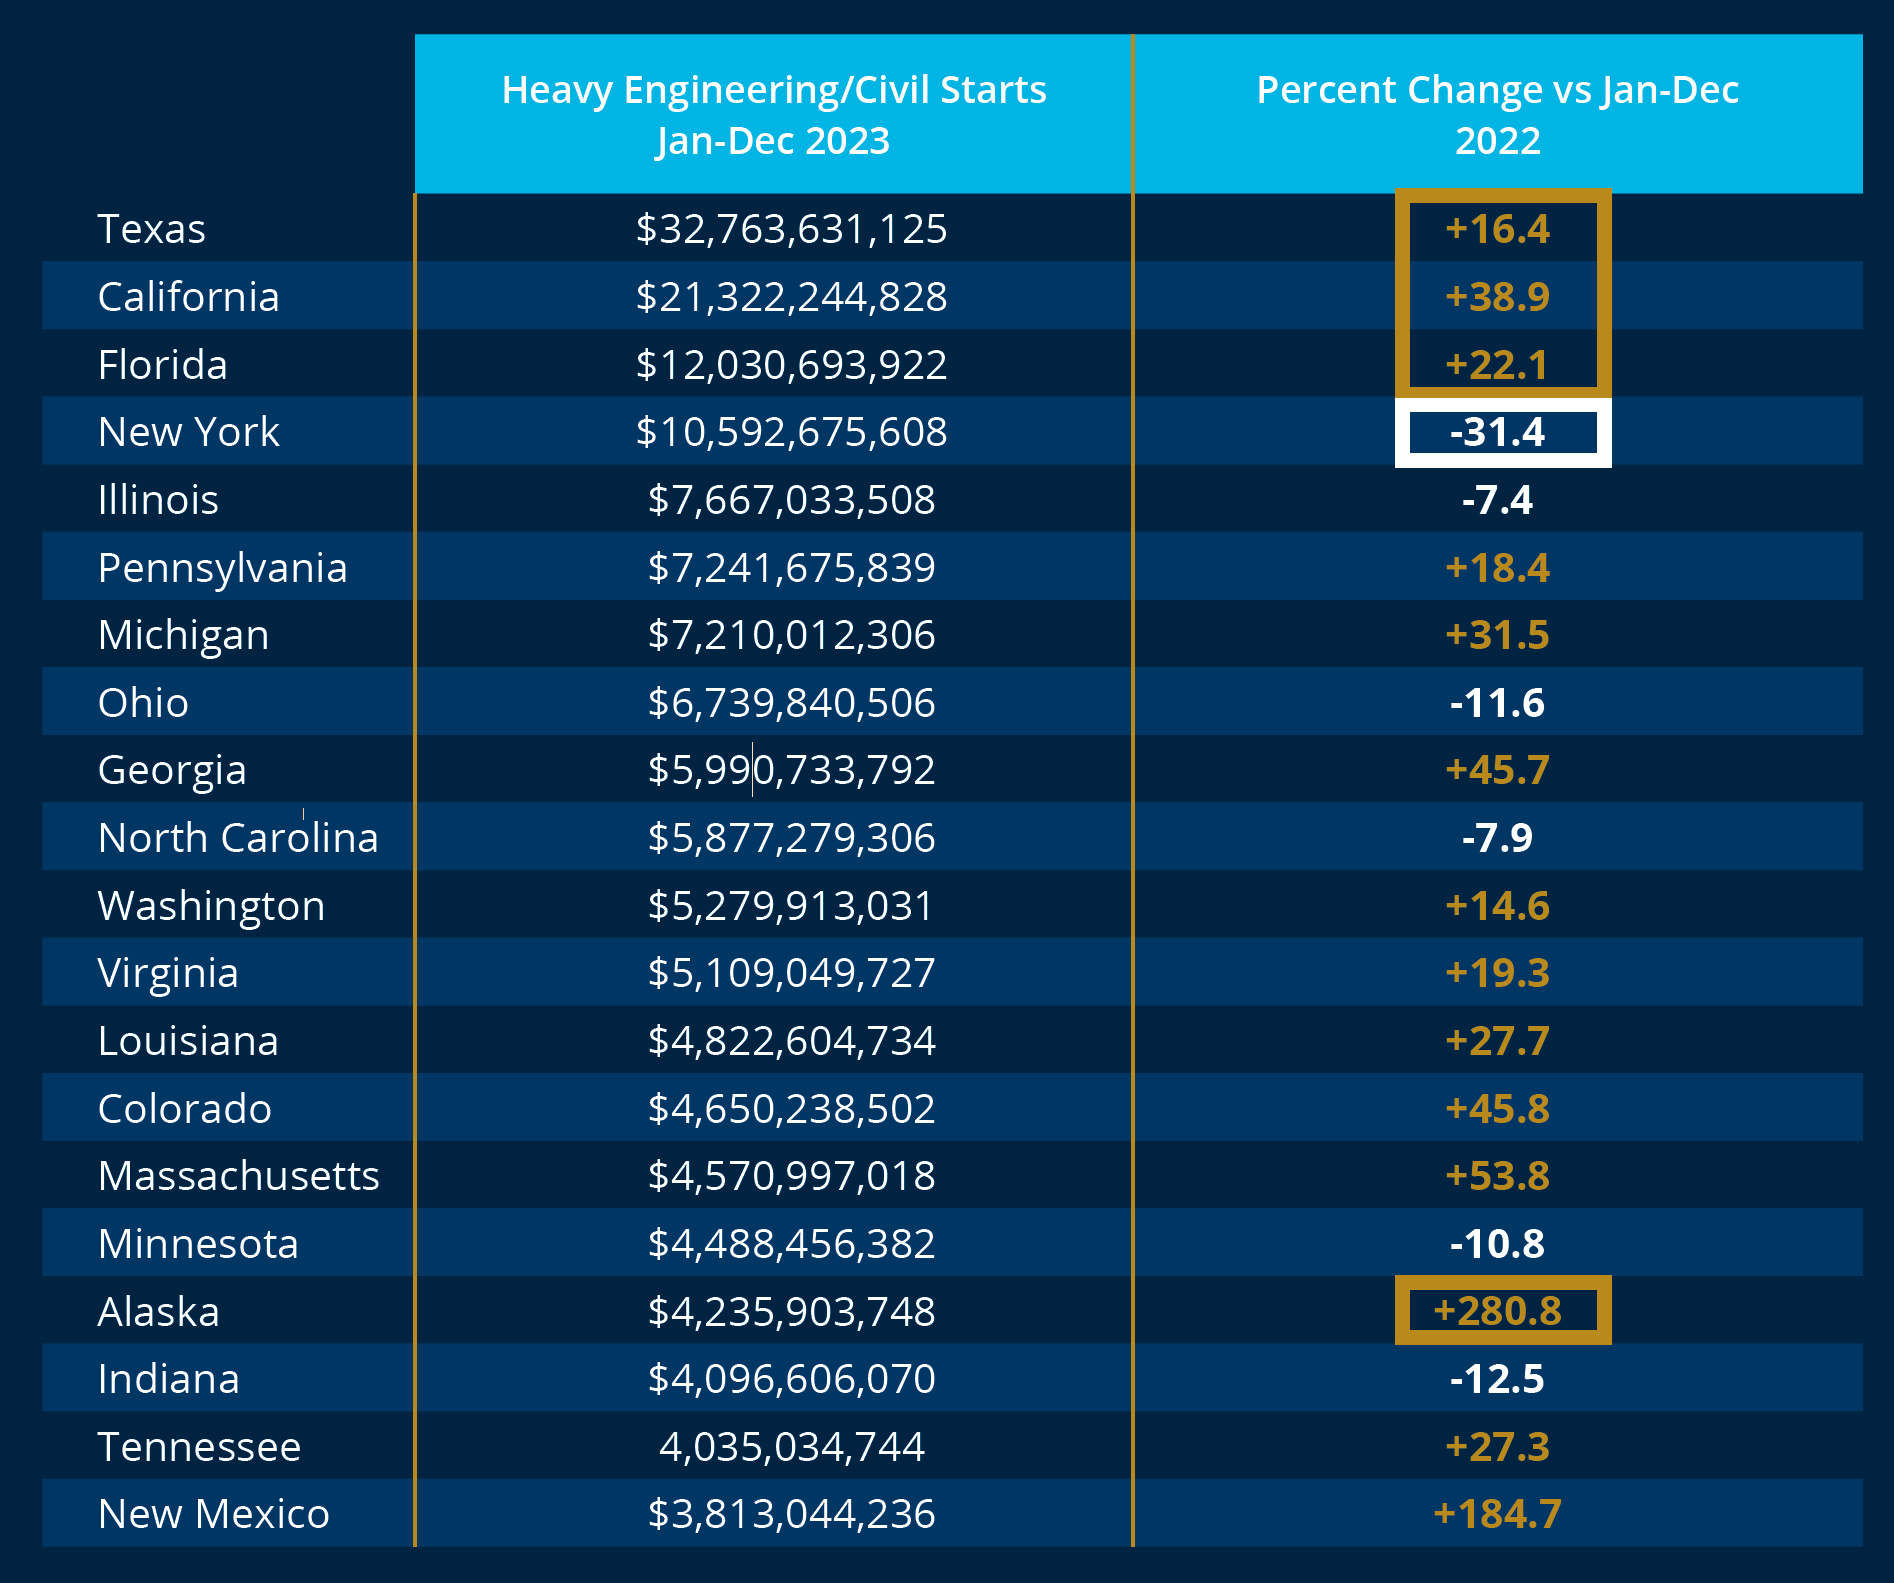
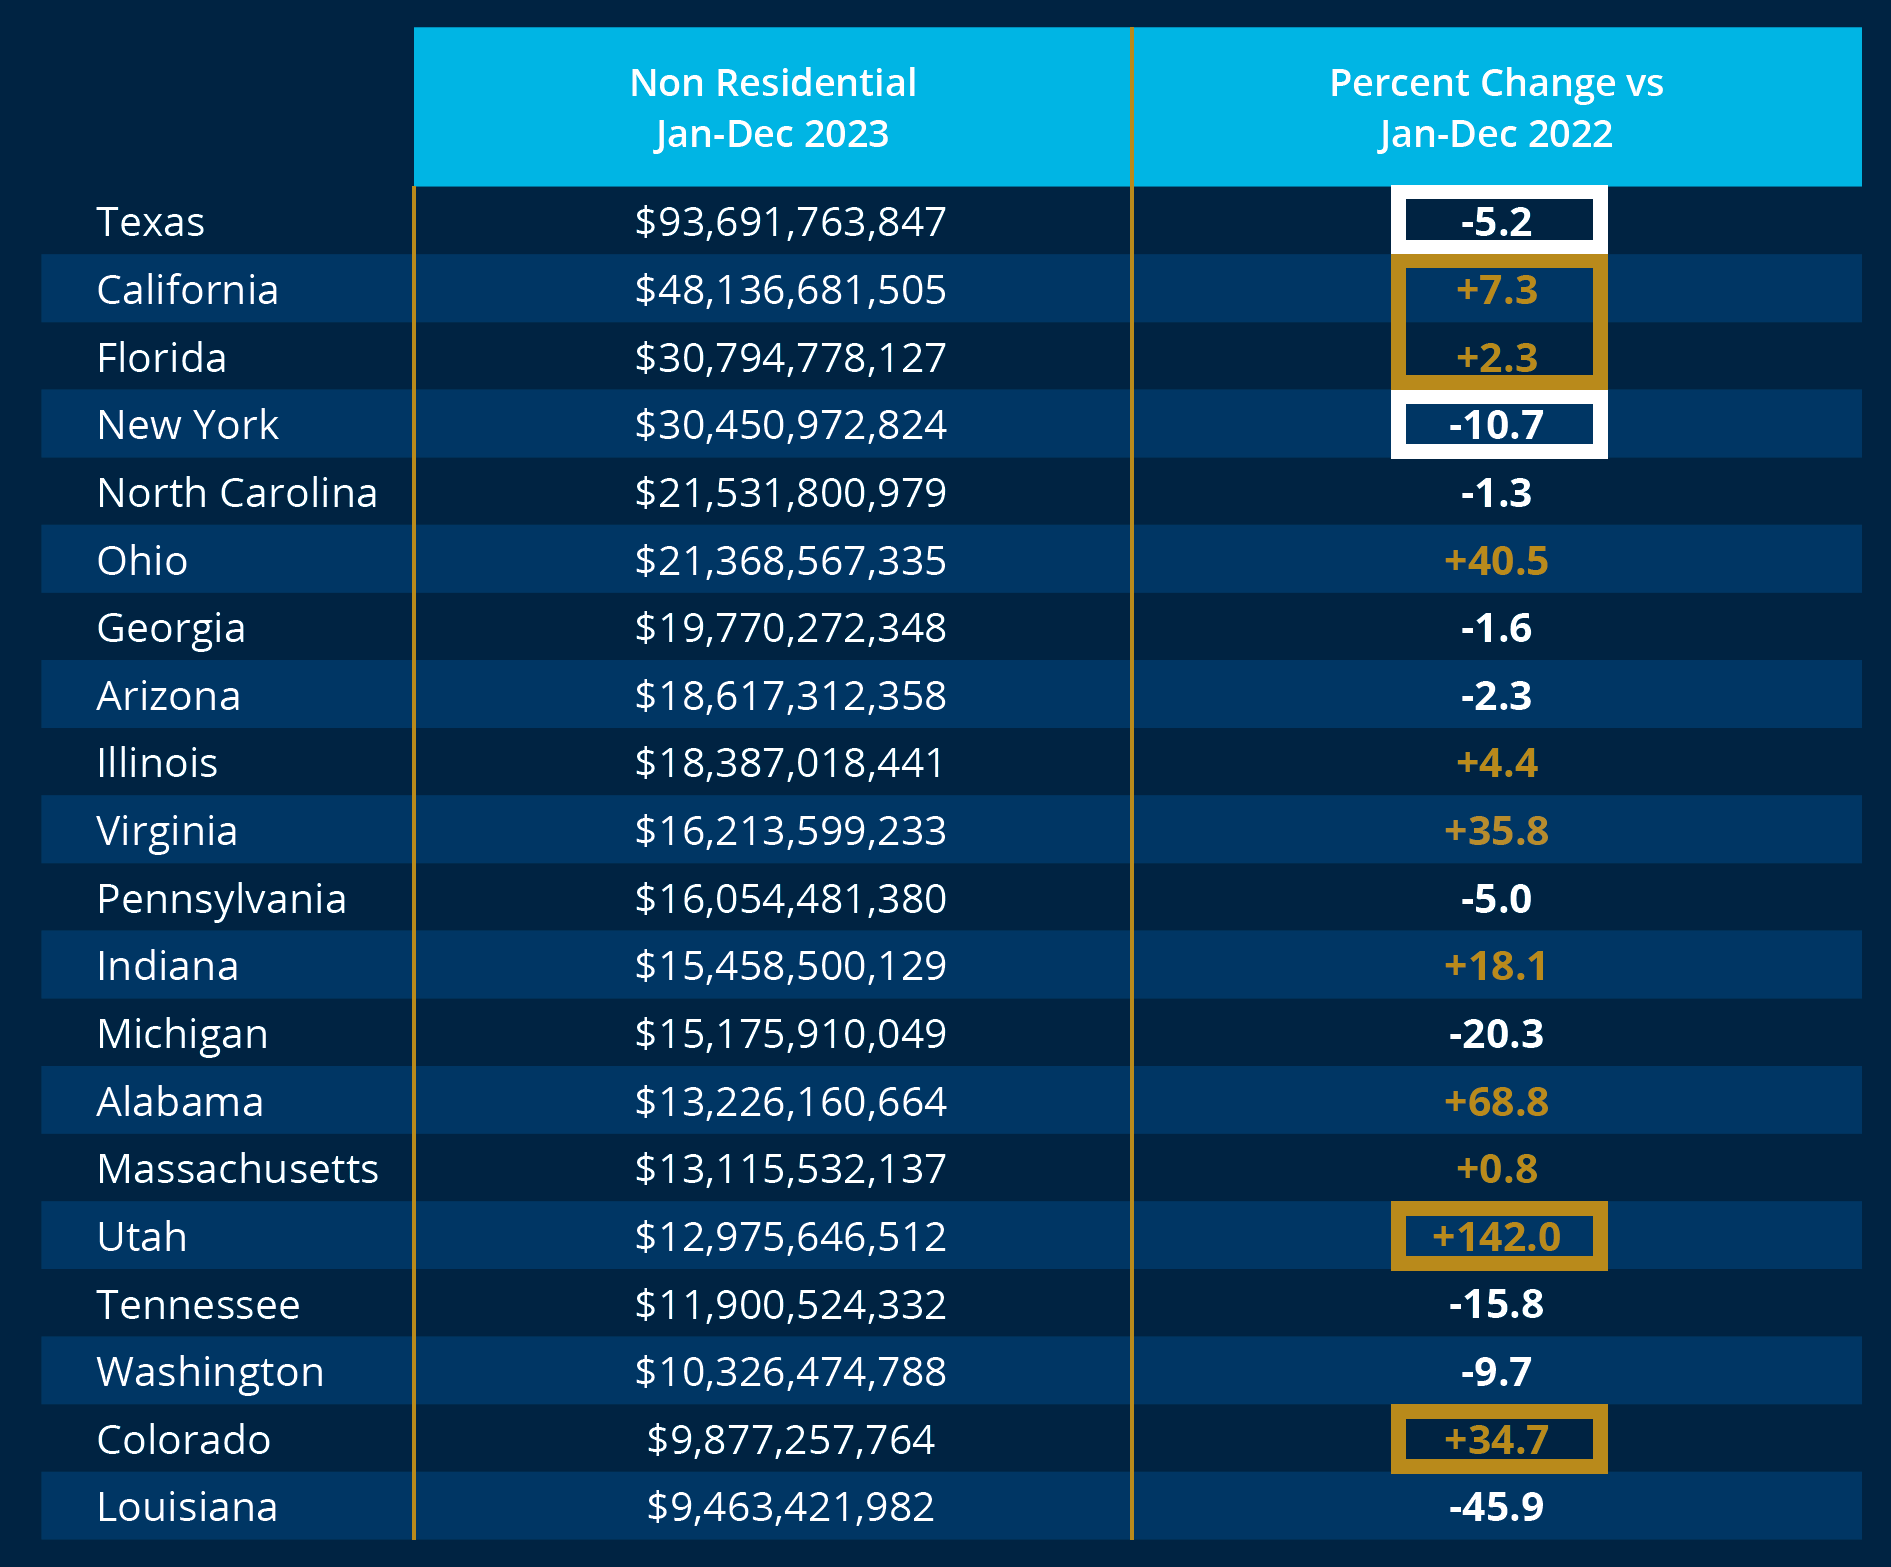
According to Dodge Data Analytics, the value of construction starts for 2023 was down 4%, with nonresidential down 8%. According to ConstructConnect, the value of nonresidential construction starts was up 3.48%. Considering both, the amount of spending start in 2023 for nonresidential is tepid at best.
Public spending is significant in Texas, California, and Florida but down in New York; nonresidential spending starts are down in Texas and New York and low single-digit increases in California and Florida. This points to government spending becoming a more critical part of overall construction projects in the country’s four largest states.
The Architectural Billing Index (ABI) is a leading indicator in the construction industry. The ABI, surveyed by the American Institute of Architects (AIA), measures whether architects are billing more or less than the previous months. If the index is above 50, it indicates growth, while below 50 suggests a decline.
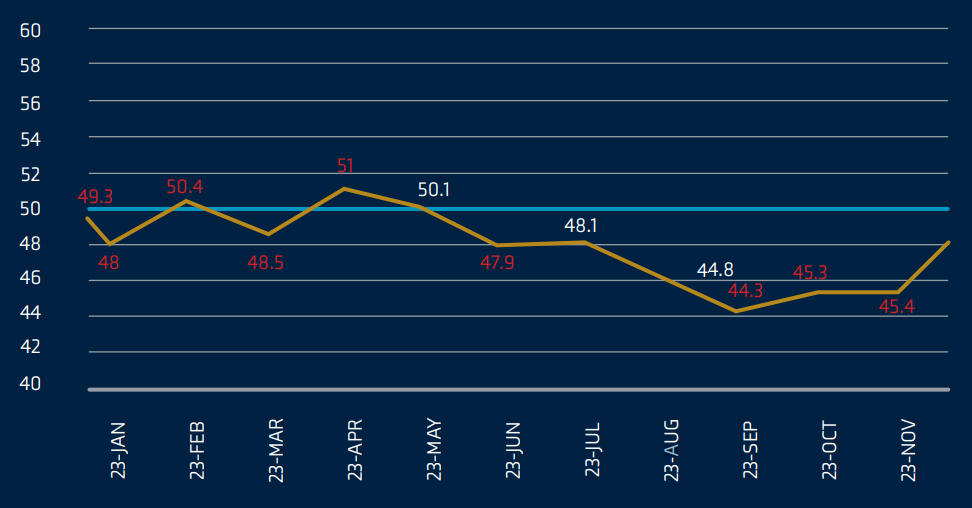
Total construction spending has shown growth December year-over-year, with significant increases in both nonresidential spending up 20% and residential spending up 6.8%. Investor activity is a driving force behind single-family residential spending, particularly in the Build-to-Rent space and townhomes. Despite stabilized material prices, persistent challenges such as a shortage of skilled labor and higher interest charges continue to stress specialty contractors. To attract workers, construction wages have increased by 5.2% over the past year. The demand for concrete is expected to rise further due to increased federal spending on infrastructure projects. However, the Project Stress Index has recorded a concerning increase, primarily driven by project abandonments and delays. Although the Architectural Billings Index has shown improvement in the last six months, it has remained negative for 13 months, impacting future spending. The recent upward trend may reflect optimism among owners regarding the interest rate environment. Our comprehensive analysis underscores the growing disparity between public and private spending, posing additional risks as federal regulations on wages and employer responsibilities are enforced.
Angela Thompson
Sr. Marketing Specialist, Market Intelligence & Insights