The U.S. property and casualty insurance market entered a period of relative stabilization in 2025, marking a significant shift from the prolonged hard market conditions that characterized the previous several years. This stabilization continued through the first half of 2025 as price increases continued to moderate, though the performance of coverage lines is starting to invert. Commercial auto and excess liability lines remain challenging, even with a slight decrease in the first half of 2025. General liability bumped up by 1.4% to a 3.7% overall increase, and commercial property held steady with a 3.6% increase.1 Premium growth is projected to decelerate from 2024. The rebound is attributed to improved underwriting results across personal lines of business, while commercial lines remained flat. Industry return on equity is expected to stay around 10% in 2025, supported by improved underwriting results and higher investment yields.2 The market demonstrates strong underlying fundamentals, with the industry posting a $4.1 billion net underwriting gain in the first nine months of 2024, compared to a $32.1 billion loss in the same period of 2023, reflecting successful rate adequacy measures implemented over recent years. The property and casualty (P&C) industry as a whole has a strong outlook, with 97% of insurers rated A- or higher, and nearly 82% of rated insurers have a stable outlook.3
Yearly Comparison
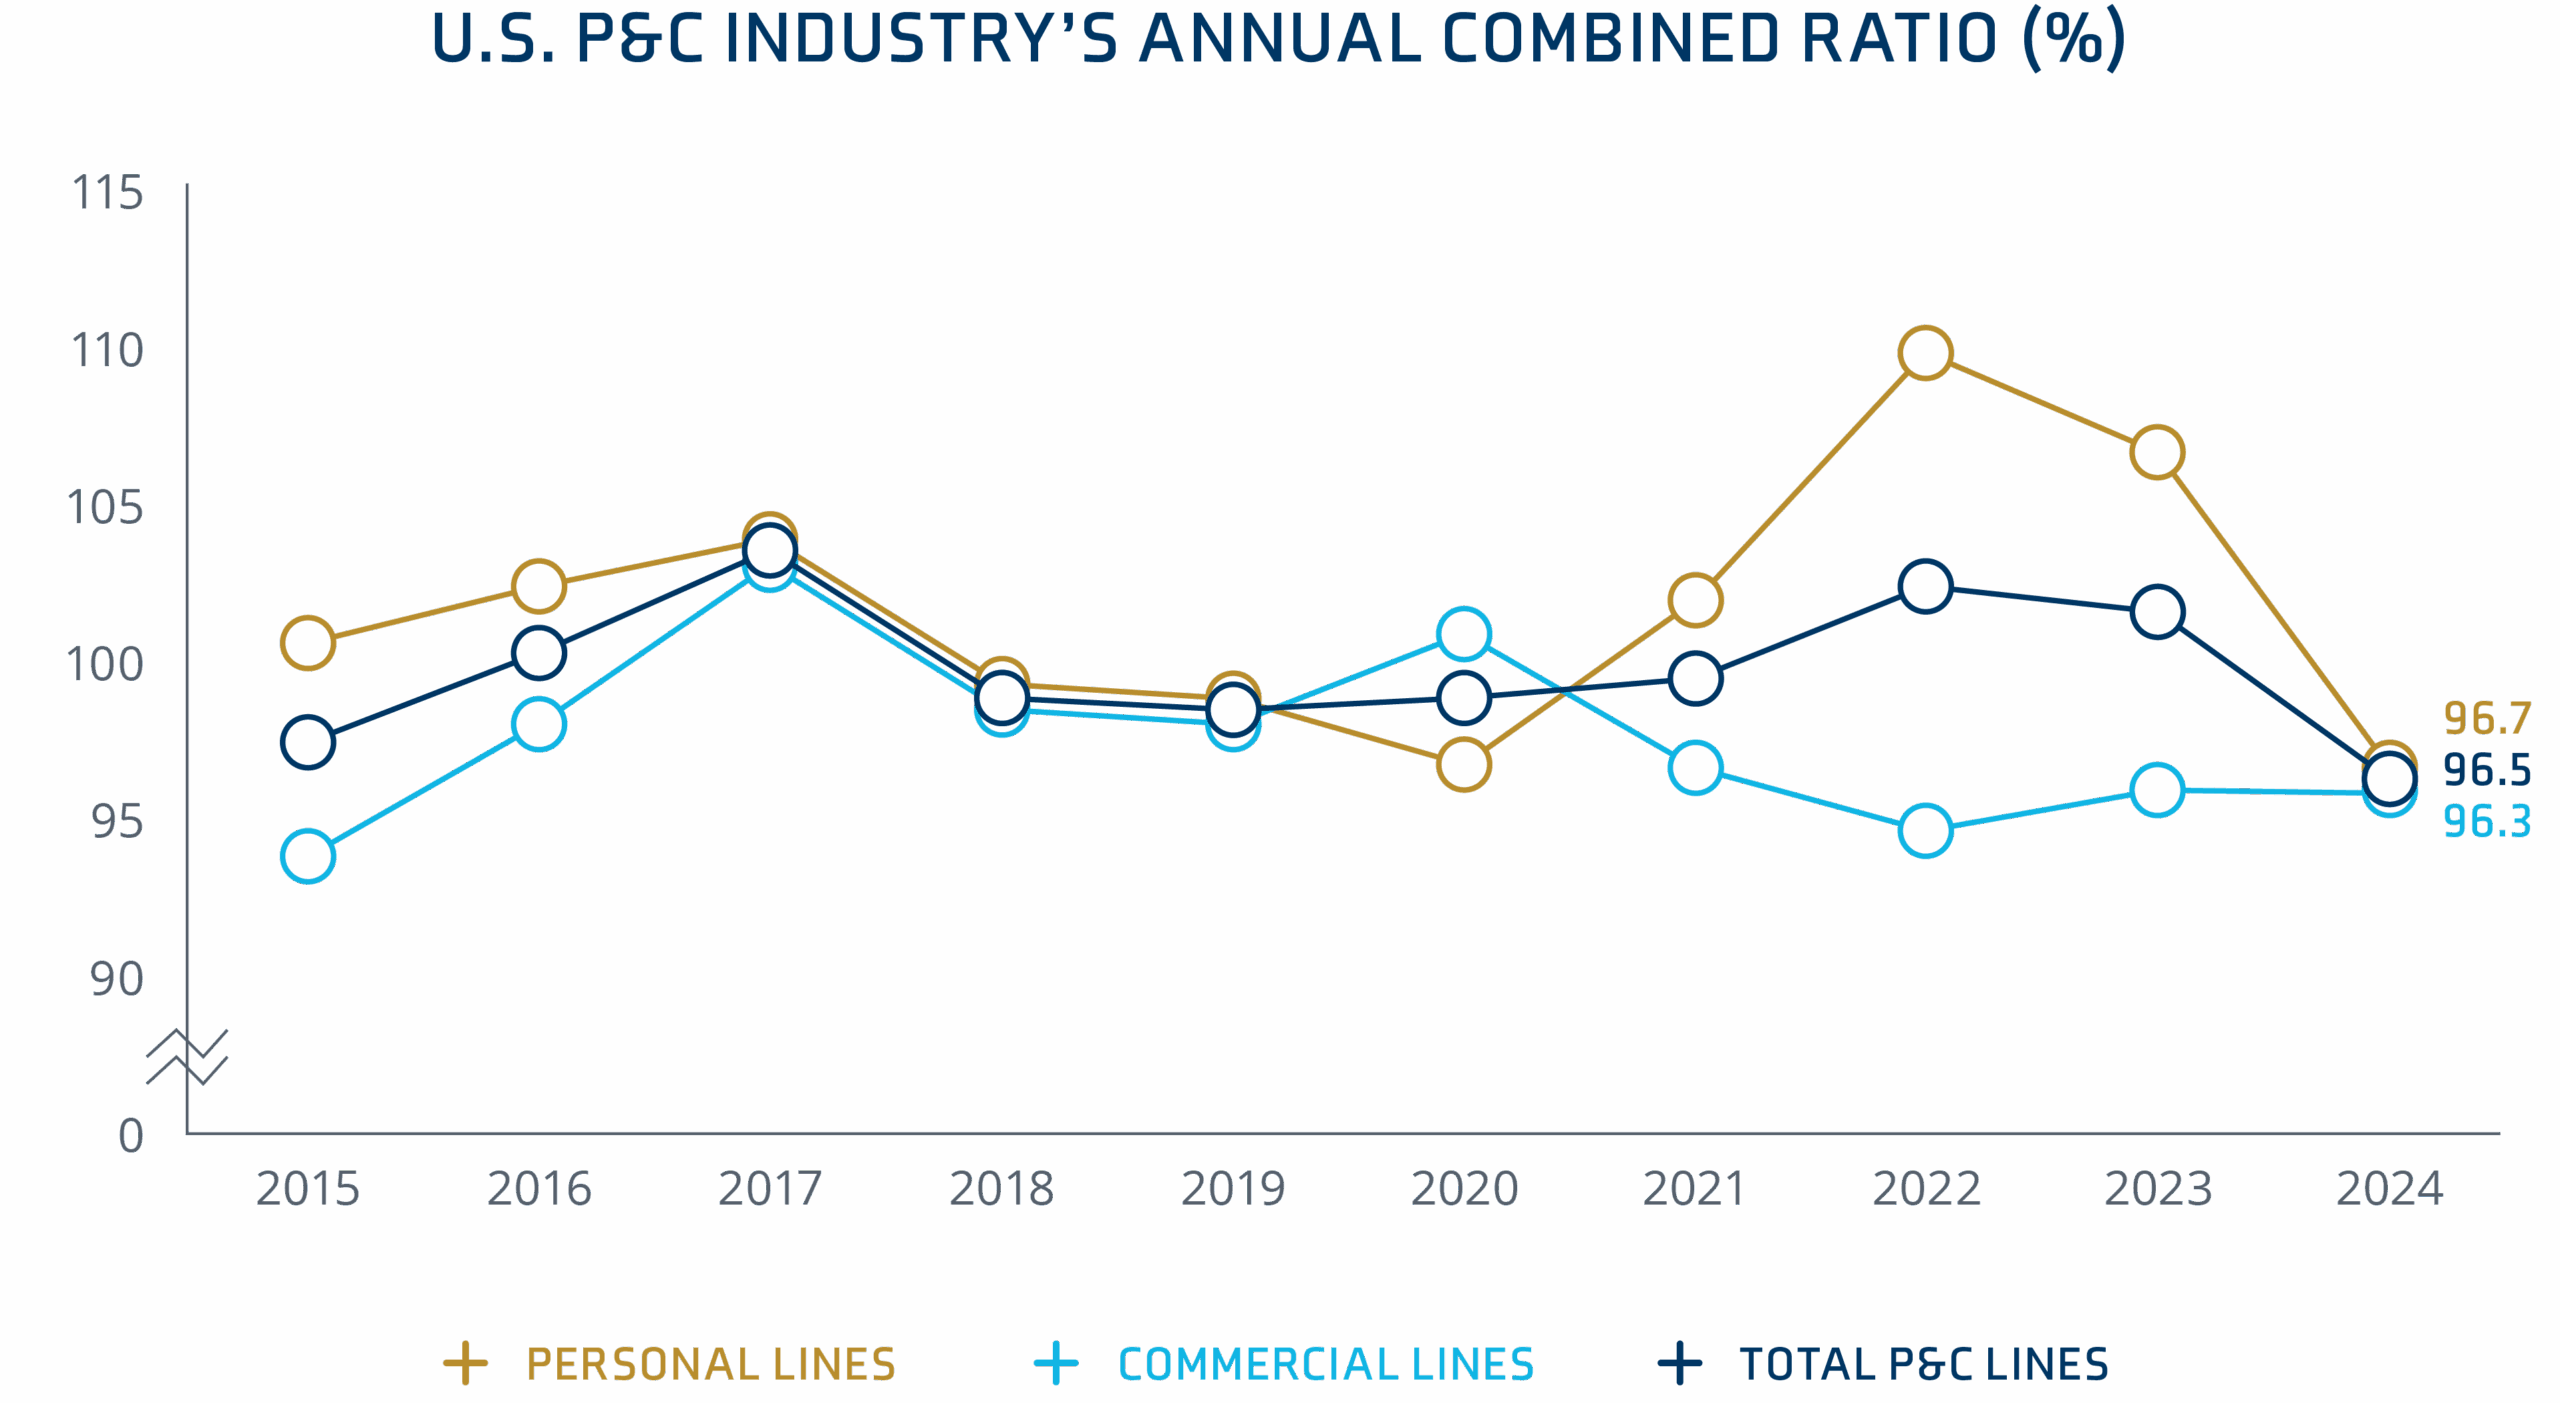
The transformation from challenging market conditions in 2024, the U.S. P&C industry recorded its best underwriting performance in over a decade. In 2023, the industry reported underwriting losses of $21.3 billion and a combined ratio of 101.6%. In contrast, in 2024, the industry achieved a net underwriting gain of $22.9 billion and a net combined ratio of 96.5%.4
Between personal and commercial lines, P&C saw a 10% increase in net premiums written (NPW) in 2024. With a 12.9% increase to a 6.1% increase, personal lines outperformed commercial lines in 2024 NPW.5
The current environment reflects a narrowing gap between personal and commercial lines profitability, with personal lines loss ratios improving dramatically from their elevated 2023 levels,
The net combined ratio of aggregated commercial lines remained flat in 2024, at 96.3%, when compared to a 96.2% rate in 2023.
By the end of 2024, dedicated reinsurance capital reached $463 billion, due to improved asset valuations, retained earnings, and increased interest from institutional investors.6
Source: US P&C industry achieves best underwriting results in over a decade in 2024. S&P Global7
Inflation Impacts & Supply Chain Constraints
P&C premium growth typically tracks with economic growth, but has diverged recently in response to the spike in loss cost inflation.8 Tariffs and inflation’s impact have so far been particularly noticeable for motor vehicle parts and construction materials.9 These uncertainties weigh on the auto and construction industries, which have struggled over the past few years with increased pricing and materials shortages. Businesses are shifting towards domestic sourcing, which can evolve risk profiles, creating new underwriting opportunities or exposure considerations. Social inflation continues to drive elevated loss ratios in general liability and commercial auto liability lines. It is a reason for the industry’s substantial reserve additions, indicating insurers are still struggling to price for this persistent trend accurately. Slowing premium growth and persistent inflation pose challenges to maintaining profitability. Potential shocks from the continued stickiness of inflation or a drawn-out USMCA tariff situation could threaten vulnerable industries, such as construction, particularly during concentrated time of demand like catastrophe.
Climate Shaping Risk Profile and Market Conditions
In 2024, the annual global mean temperature exceeded the pre-industrial (1850-1900) temperature baseline level by 34.79°F. This is the first time the yearly global mean temperature has exceeded 34.7°F and surpasses the threshold identified in the 2015 Paris Agreement as critical for avoiding the most severe impacts of climate change.10 Climate change has fundamentally altered the P&C risk landscape, transforming what were once considered secondary perils into primary concerns. Physical climate risks are increasing the scope of risk aggregation, with some risks becoming difficult to insure at reasonable rates. Private insurers have increasingly reduced coverage in high-risk areas, concluding that climate risks outweigh probable profits. The industry faces the challenge of developing tools and processes for spatial risk assessment, with actuarial models needing to incorporate climate science projections beyond historical experience.
Major Disasters: Hurricanes, Wildfires, and Severe Convective Storms
Catastrophe losses contributed 7.7 points to P&C insurers’ combined ratio in 2024, slightly lower than the 8.5 points recorded from catastrophe losses in the previous year. Average annual insured losses from natural disasters have surged 90% over the past decade, highlighting the persistent upward trend in catastrophe frequency and severity.11 California wildfires generated $50 billion in insurance claims in Q1 2025. They will add about three percentage points (ppt) to the industry’s net combined ratio for 2025, depleting nearly half of the industry’s annual catastrophe budget.
Catastrophic events across multiple peril categories dominated 2024.
Hurricanes Helene and Milton were the most destructive disasters, with Helene causing $17.5 billion in insured losses and Milton generating $20 billion in insured losses.12
Severe convective storms continue to grow as a loss driver, with 2023 and 2024 the two highest years on record, with a combined $92 billion in insured losses.13
Global insured catastrophe losses totaled $80 billion in the first half of 2025.14
Insurers are adapting strategies, becoming more selective with risk appetites, especially in high-risk areas, and are also enhancing underwriting measures to mitigate potential losses.
Market Outlook
Property
Pricing across most reinsurance rates fell at mid-year for loss-free properties as much as 10% – 15%.15
In recent years, markets held the advantage on terms, conditions, and pricing, but the balance has now shifted in favor of buyers.
This downward trend in rate is prevalent across various regions, particularly with loss free accounts.
Shared and layered coverage remains prevalent, particularly for convective storm risks. Higher deductibles and self-insuring/self-funding are being utilized creatively to manage risks and costs.
Capital providers are optimistic regarding property, pursuing growth and driving competition.16
E&S property insurance grew at the slowest pace in five years but still accounted for more of the total premiums written at 11.5%.17
Higher-risk or catastrophe (CAT) prone areas, such as those affected by Florida hurricanes and California wildfires, are receiving rate decreases. These rates were on the higher side of the rate increases in the past several years. Even with the shift in rates, many of these remain above the rates from three or four years ago.
A few key standard markets offering shared and layered programs that require significant limits – $1 billion to $2 billion plus – are receiving rate decreases, but not to the same extent as the smaller limit programs, where the E&S marketplace is driving rate changes.
General Rate Change Estimates
Middle Market
Down 5% to Up 8%
Large / National / Shared & Layered Accounts
Down 10% to 35%+
Casualty
General Liability
Reinsurers’ appetite in the U.S. casualty market is mixed, with some withdrawing from the market while others take up the slack.18
The liability market is facing significant challenges, with substantial double-digit increases, and securing primary layer coverage is more difficult.
Terms and conditions are becoming more flexible as reinsurers become more willing to protect programs, including lower attachment points and more frequent return periods.19
While terms are becoming flexible, competition remains limited for higher-risk clients.
Social inflation remains a factor driving up litigation costs, jury awards, and claims settlements.20
General liability rates increased by an average of 3.9% in Q2 25, which was down from 4.2% in Q1 25.21
As coverage prices increase in upper towers of coverage, organizations are experiencing sticker shock and looking to pull back on full coverage limits. This trend seems to be more of a hunt for price savings over strategy, though it increases the organization’s exposure.
General Rate Change Estimates
General Liability
Up 3.9% to 9%
Excess Liability
Capacity remains constrained, leading some owners to reduce umbrella and excess limits to control costs. Coverage appears to have stabilized somewhat, depending on the industry and loss history.
In 2024, E&S direct premiums written reached $98.18 billion, a 13.4% YOY increase.22
E&S premiums now account for 9.5% of the total U.S. direct premiums written.23
Nuclear verdicts continue to impact underwriting, making it difficult for some businesses to secure excess coverage.24
Umbrella premiums rose by 11.5% in Q2 2025, the highest premium increase of any lines driven by the impact of large claims verdicts.25
General Rate Change Estimates
Umbrella & Excess Liability
Up 10% to 15%
Workers’ Compensation
Workers’ compensation continues to drive profitability for the industry as rates have been decreasing steadily for over 15 years, due to improved injury results. As a whole, the market remains soft, with loss ratios remaining profitable in most states.
California is entering a hardening market with rates increasing due to greater exposure. New York and New Jersey remain expensive to operate in similar conditions.
Insurers are asking companies to ensure their independent contractors have workers’ compensation insurance, which can result in significant and unexpected claims at audit and impact modifications for three years.
In addition, insurers are asking companies to perform due diligence on debit modification factors during M&A activities, as it can impact premiums and experience ratings after the merger.
Insurers are being much more selective in their appetite for risk, by industry, with a much stricter auditing application upon policy expiration.
While workers’ compensation continues to perform well, with strong net combined ratios in 2023 and 2024, headwinds are affecting this coverage with insurers taking note. Insurers are picking up costs at audit for injuries to uninsured independent contractors and workers at 100% of payroll, resulting in significant and unexpected expenses at audit.
General Rate Change Estimates
Workers’ Compensation
Down 10% to Flat
Auto
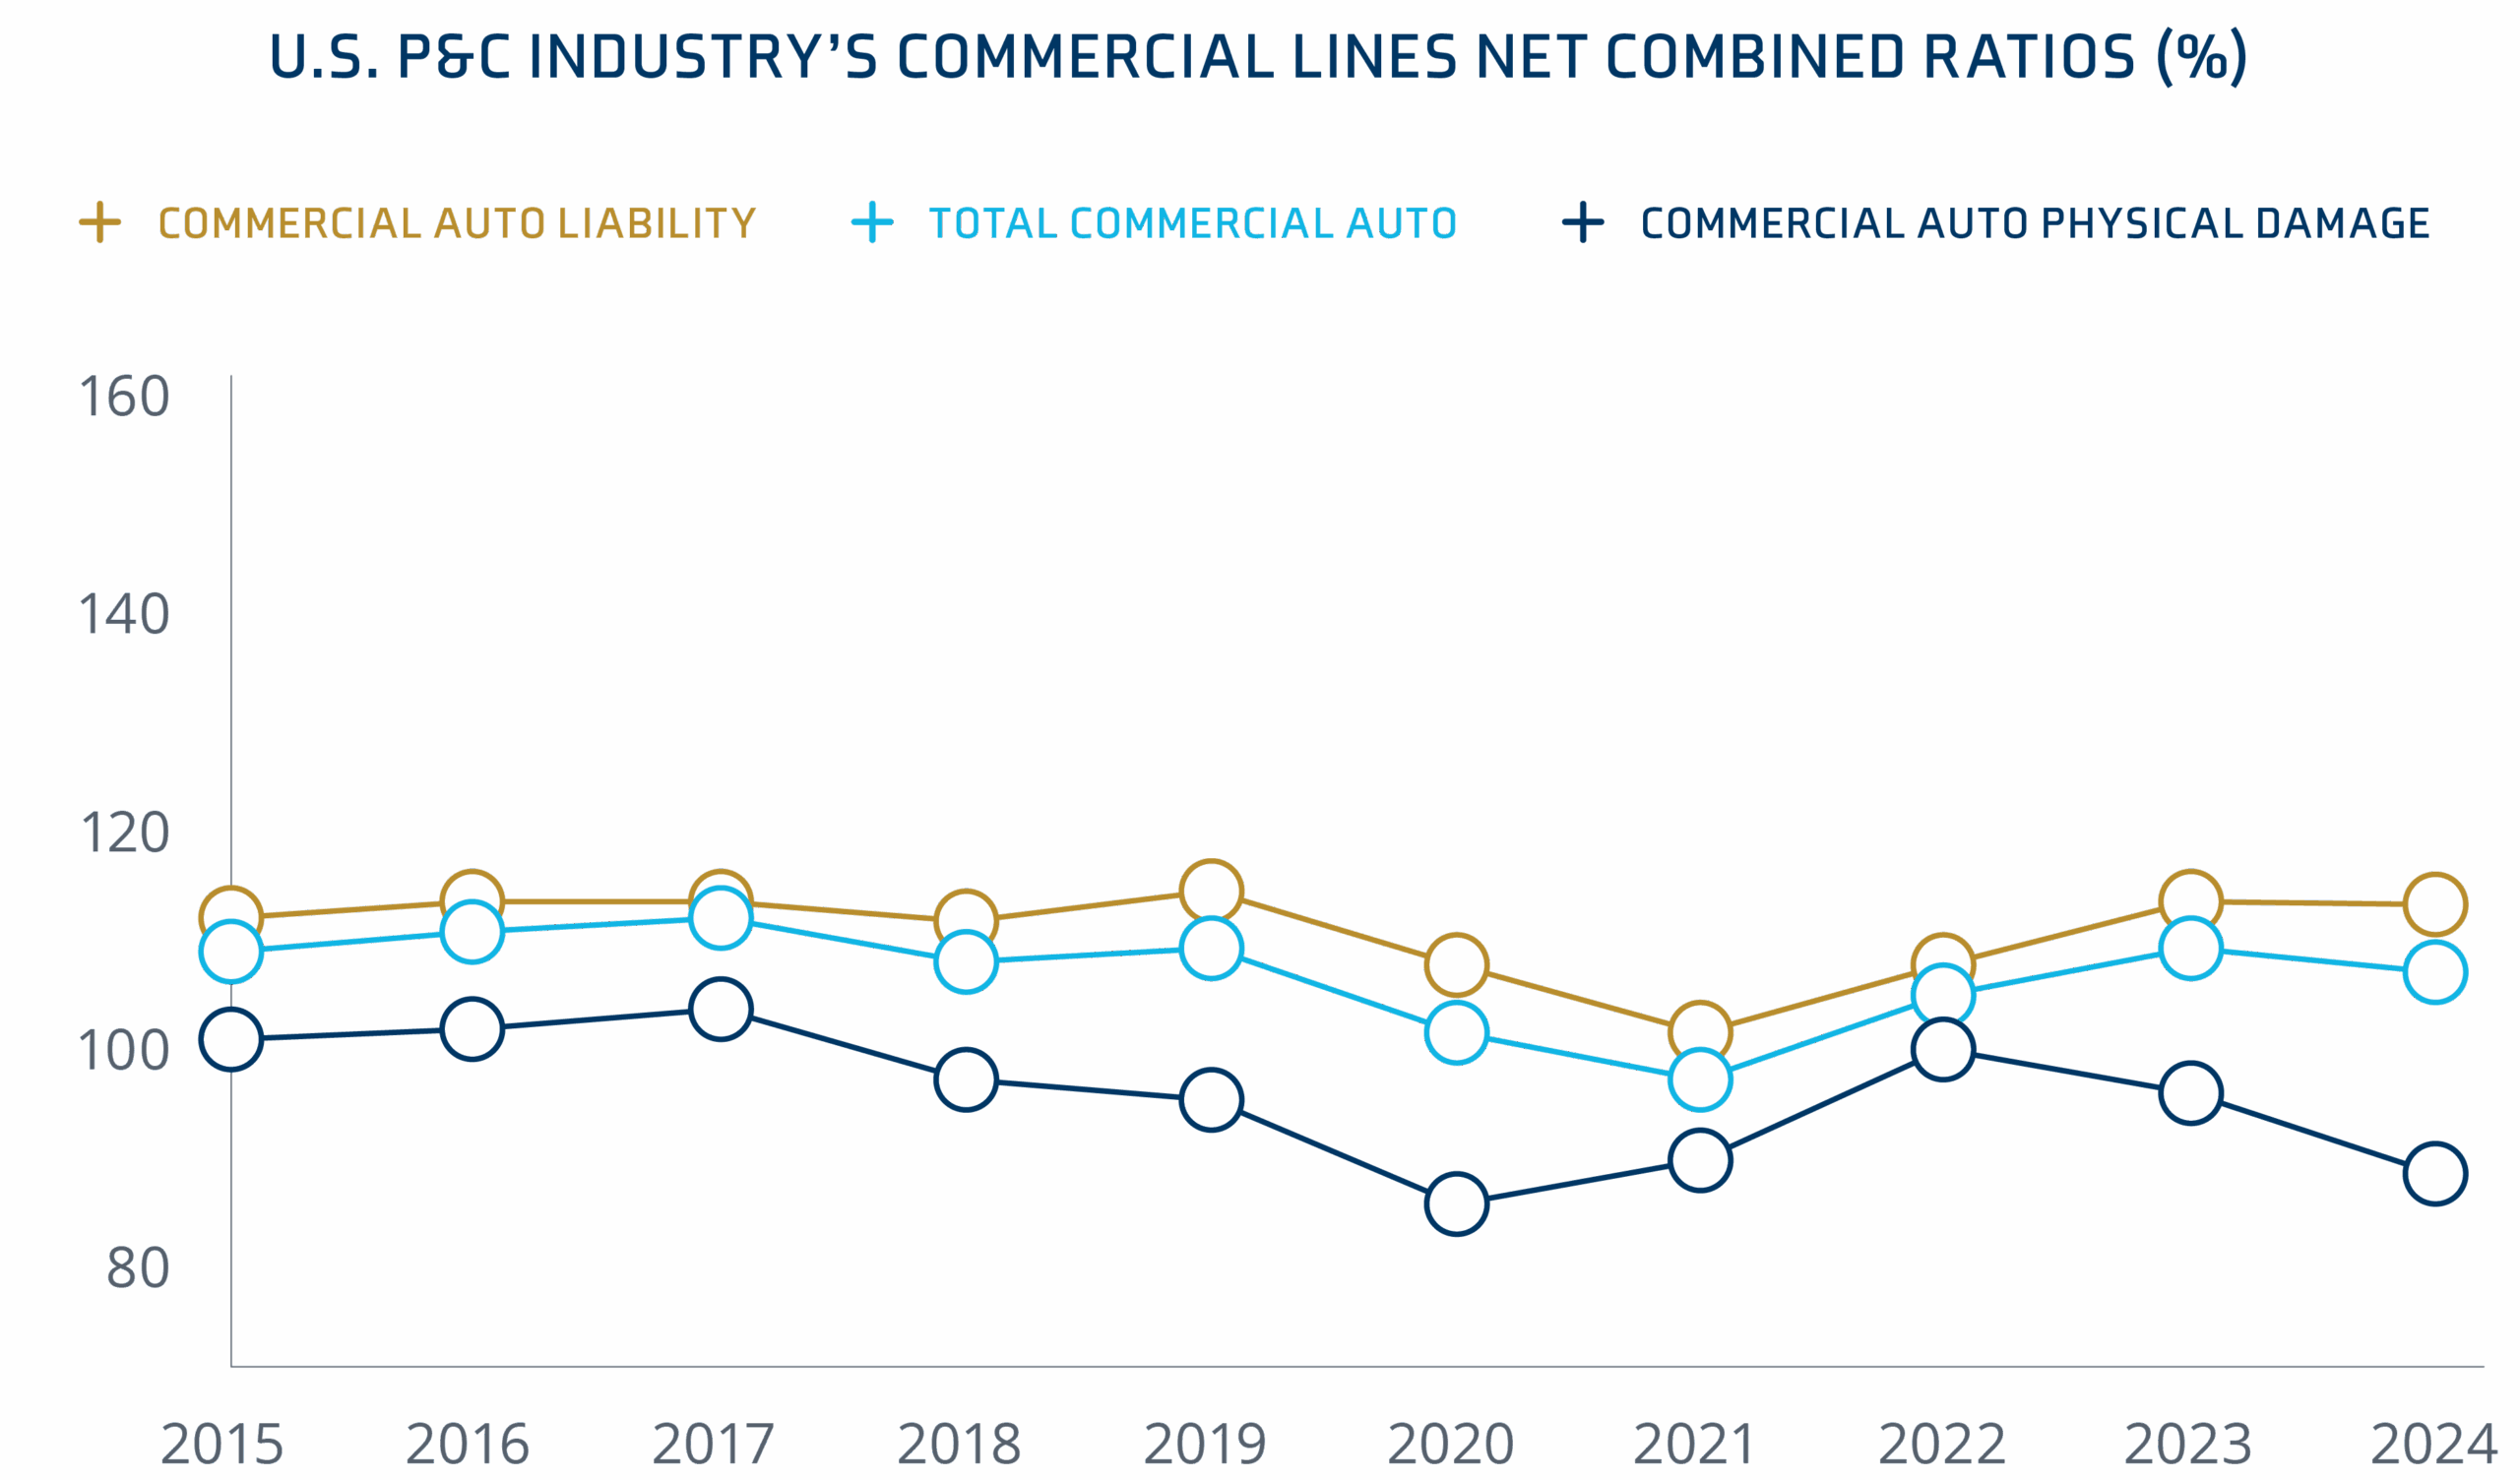
Commercial auto liability continues to experience increases, with rates significantly higher than in years past, and often with higher limits needed to reach umbrella limits.
The E&S commercial auto market grew by 22.4% in 2024 due to the admitted market’s caution on coverage, prompted by social inflation on claims.26
Commercial auto rates increased an average of 8.8% in Q2 25, a moderate increase from Q1 25.27
Tariff impacts continue to prompt insurers to prepare to offset rising claims costs with increased premiums.
Hired and non-owned coverage has become a focal point of increased scrutiny. While it was once added for a modest premium, carriers now demand extensive information, and the cost has risen significantly.
Source: US P&C industry achieves best underwriting results in over a decade in 2024. S&P Global28
General Rate Change Estimates
Auto
Up 10% to 20%
Executive Risk
Directors & Officers (D&O) Public
Although D&O litigation remains elevated over historical levels, overall market conditionsremain favorable.
The downward pressure on pricing and, in certain instances, retentions, over the last year and a half has slowed down, but capital remains plentiful and competitive.
Some carriers are struggling to build critical mass, and a handful have exited the market. Partnering with strong and stable D&O capital providers should remain an important consideration.
Mid-market companies may be buying more D&O coverage than they need, by as much as $15 to $20 million, with total claims settlements averaging nearly half of their total coverage.29
The current pricing environment remains a tale of supply and demand, driving competition among businesses.
New capacity has entered the market while IPOs and de-SPAC transactions have declined.
Carriers remain cautious towards companies with near-term capital needs or a high likelihood of M&A.
Soft market conditions for D&O liability continue to drive the ongoing reduction of premium rates and retentions.
Source: Executive Risk Solutions Quarterly Update July 202530
Cyber
Social engineering and ransomware remain the most prevalent claims, but there has been an uptick in AI-powered phishing attacks.
Many social engineering attacks focus on getting help desks to reset credentials, which allow bad actors to access network assets. It is important to remember that many of these help desks are outsourced.
Third-party vendor exposure is the number one cyber threat, accounting for 31% of all claims and 24% of material losses.31
Companies need to pay close attention to security and privacy terms in service agreements.
Contracts should include language covering errors & omissions, as well as cyber coverage, particularly when dealing with third-party vendors.
Rates remain competitive and flexible, but carriers are looking at third-party contracts for risk exposure.
Organizations with strong IT security and privacy policy compliance are benefiting from a stable and insurance-friendly market.
Carriers are starting to limit their exposure to data and privacy claims if insureds do not outline a clear strategy.
General Rate Change Estimates
Cyber
Down 1.5% to Flat
Major Claims in The Sector
Personal Injury | Negligence
$48.79 Million Award The plaintiff was struck by a garbage truck in California while in a crosswalk. He sustained severe brain injuries and remains in a vegetative state from which he is not expected to recover. The jury awarded $48.79 million in July 2025.32
Employment & Labor | Wrongful Termination
$27.5 Million Award The plaintiff worked as a Chief Nursing Officer in California and suffered PTSD and other issues after the suicide of a patient. The plaintiff requested better safeguards to prevent his from happening again, but these were not enacted. The plaintiff went on medical leave, and her position was filled. The jury found unlawful retaliation and awarded $27.5 million.33
Guidance
Begin the Renewal Process Early
Partner with your broker early to prepare for any changes to increase renewal success.
Partner With Industry Experts
It is important to work with your broker’s industry experts who understand the business and the market when placing the specific risk. Collaborating with a team that can best represent your risk and partner with your operations is more critical than ever in this disciplined market.
When placing the specific risk, it is important to work with your broker’s industry experts who understand the business and the market. Collaborating with a team that can best represent your risk and partner with your operations is more critical than ever in this disciplined market.
Contract Review
Our contract review team adds value to our clients’ overall risk management program by ensuring the indemnity language is market standard and doesn’t expose our clients to unforeseen losses that may not be insurable.
Contributors
Jason Patchen | SVP, National Director of Carrier Relationships
Tyson Mendes. (2025, July 17). $48.79M for CA Pedestrian Left Permanently Comatose After Garbage Truck Hit Him. Tyson Mendes. https://www.tysonmendes.com/cases/↩︎