Unlocking Insights:Leveraging Data for Strategic Decision Making | Part 1
Feb 12, 2025
“Without data, you’re just another person with an opinion.” – W. Edwards Deming
Let’s face it: data can be overwhelming, and analysis paralysis is a very real issue. However, by analyzing data strategically, businesses can uncover patterns, trends, and insights that drive informed decision- making. This allows for targeted investments, improved operational efficiency, and a better understanding of your needs. Embracing a data- driven approach ensures that resources are allocated wisely; claims data should always be at the heart of any improvement plan. Spending money on claims is not an ecient use of your resources as it ultimately impacts your general ledger.
By focusing on key metrics using claim counts and normalizing data to account for exposure, organizations can effectively identify areas of improvement and reduce the cost of risk. Utilizing a data- driven approach helps overcome biases, facilitates smoother executive conversations, and ultimately leads to more successful outcomes. A clear understanding of where to focus your efforts can significantly impact the success of your program. Having supporting data readily available ensures efficient conversations with executives and actuaries.
Analyzing your historical claims data enables you to identify risk areas and take proactive measures. This approach demonstrates to underwriters that you are aware of and actively addressing critical areas. Investing in this strategy could help you appear more favorable when going to market.
Claim counts are a key indicator of where problems are occurring, but it’s also essential to consider exposure. If your Chicago facility has the highest claim counts, consider possible reasons why. It’s possible that Chicago simply operates for more hours than any other facility. You may need to normalize the data using OSHA TRIR or OSHA DART rates based on total hours worked. While dedicating resources to Chicago may initially seem benecial, normalizing the data will help determine if it is truly an impact facility.
Many corporations track TRIR and DART at the corporate level, but calculating these metrics at the facility level helps identify specic problem locations. Additionally, using these standardized metrics allows for benchmarking against peers and the broader industry using your NAICS* designation.
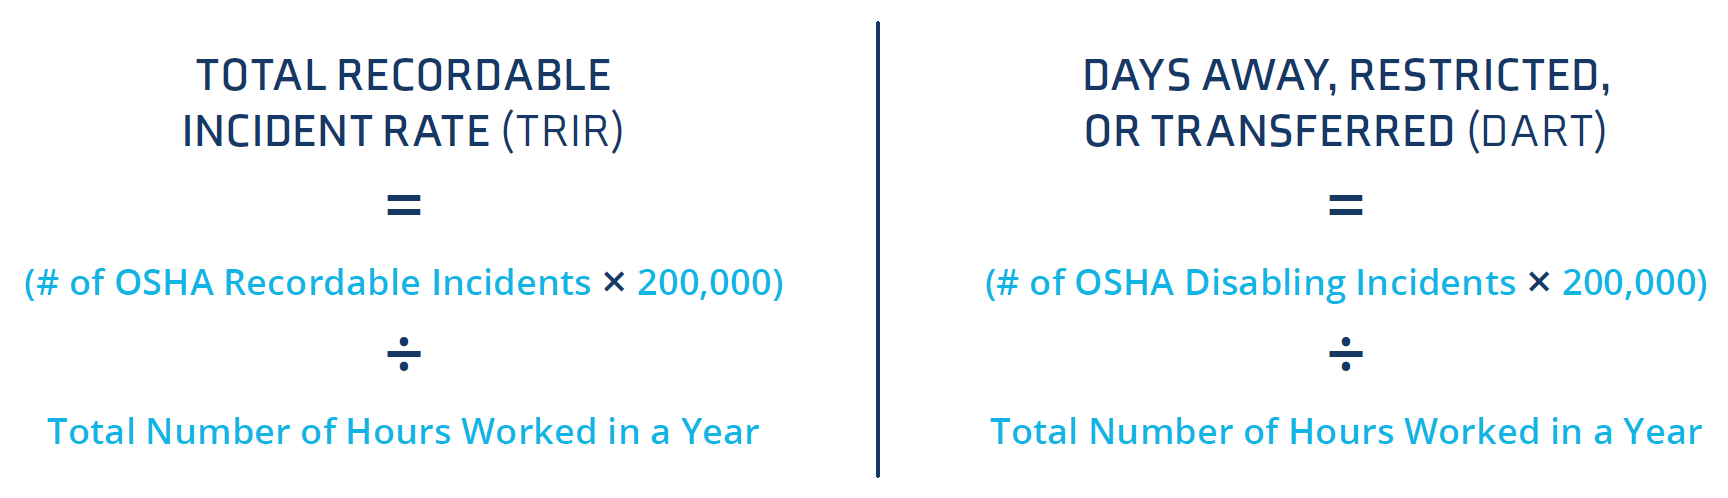
When calculating these values, don’t forget to include the hours worked by your salaried employees. If you have employees who are paid by the mile instead of by the hour, convert their mileage to hours worked at a rate of 45 miles per hour for your calculations.
Ideally, reviewing the last three full years of incident data will give you a clearer picture of trends and issues. While a thorough historical analysis can be valuable, it’s important to focus on the most relevant data for your situation. Tracking recent trends often yields more actionable insights than looking too far into the past.
Data doesn’t always provide direct answers but should prompt questions and drive meaningful discussions.
* The North American Industry Classification System (NAICS) is the standard used by Federal statistical agencies in classifying business establishments for the purpose of collecting, analyzing, and publishing statistical data related to the U.S. business economy.
Below are a few examples to illustrate the kind of questions data should prompt:
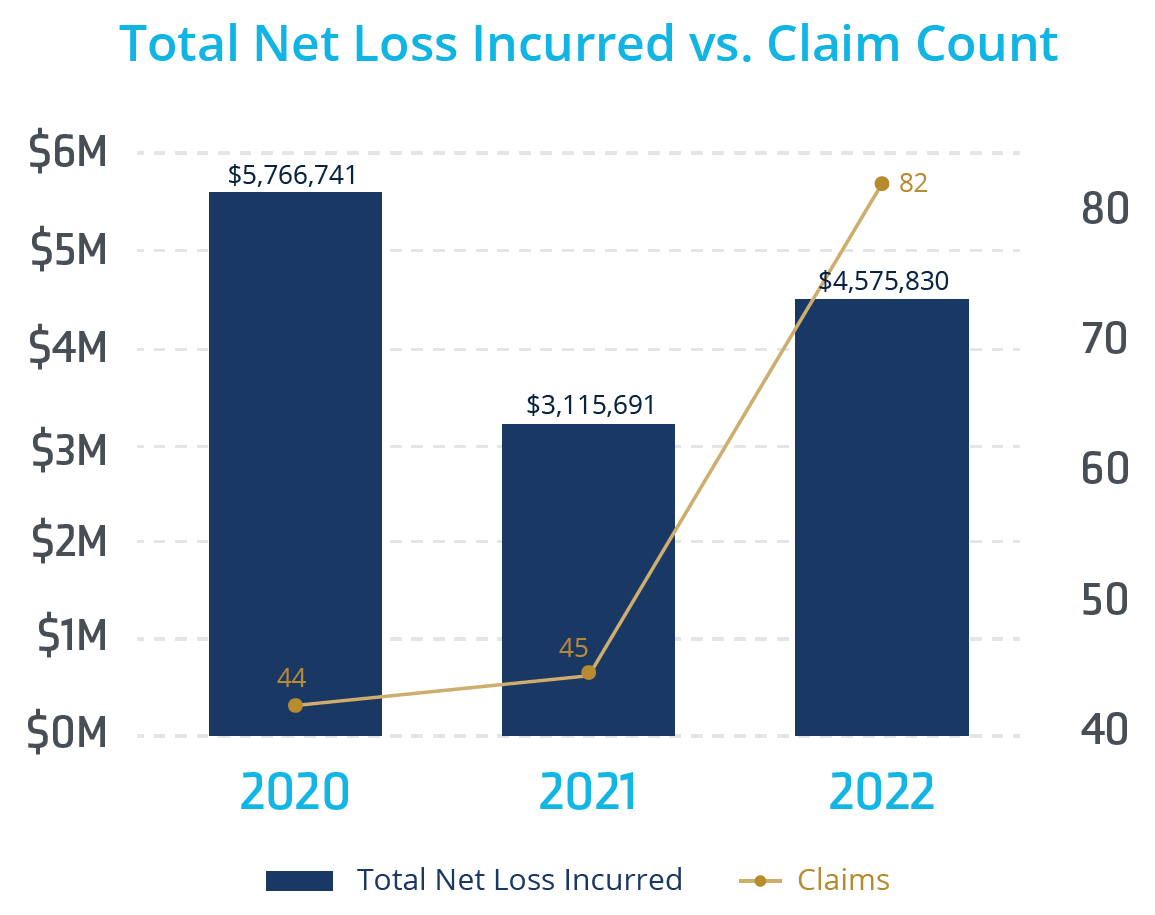
This example reflects three years of loss data. It compares the total net loss incurred (columns) against the claim counts (line) for 2020-2022. This chart reflects a current valuation view in which more recent years have yet to develop fully.
Question 1
What factors contributed to the significant increase in claim counts in 2022? Did the business acquire a new division that doubled its revenue or the number of employees? Was there a critical process change that resulted in more employees getting hurt? Was there a shift in PPE requirements or other operational adjustments that could have impacted employee safety?
Question 2
Were there any significant outliers in claims costs in 2020, particularly those exceeding $250K? This is an example of where examining data from beyond the most recent three years can be valuable in determining whether the total claim amounts or counts for 2020 and 2021 align with historical patterns or represent anomalies.
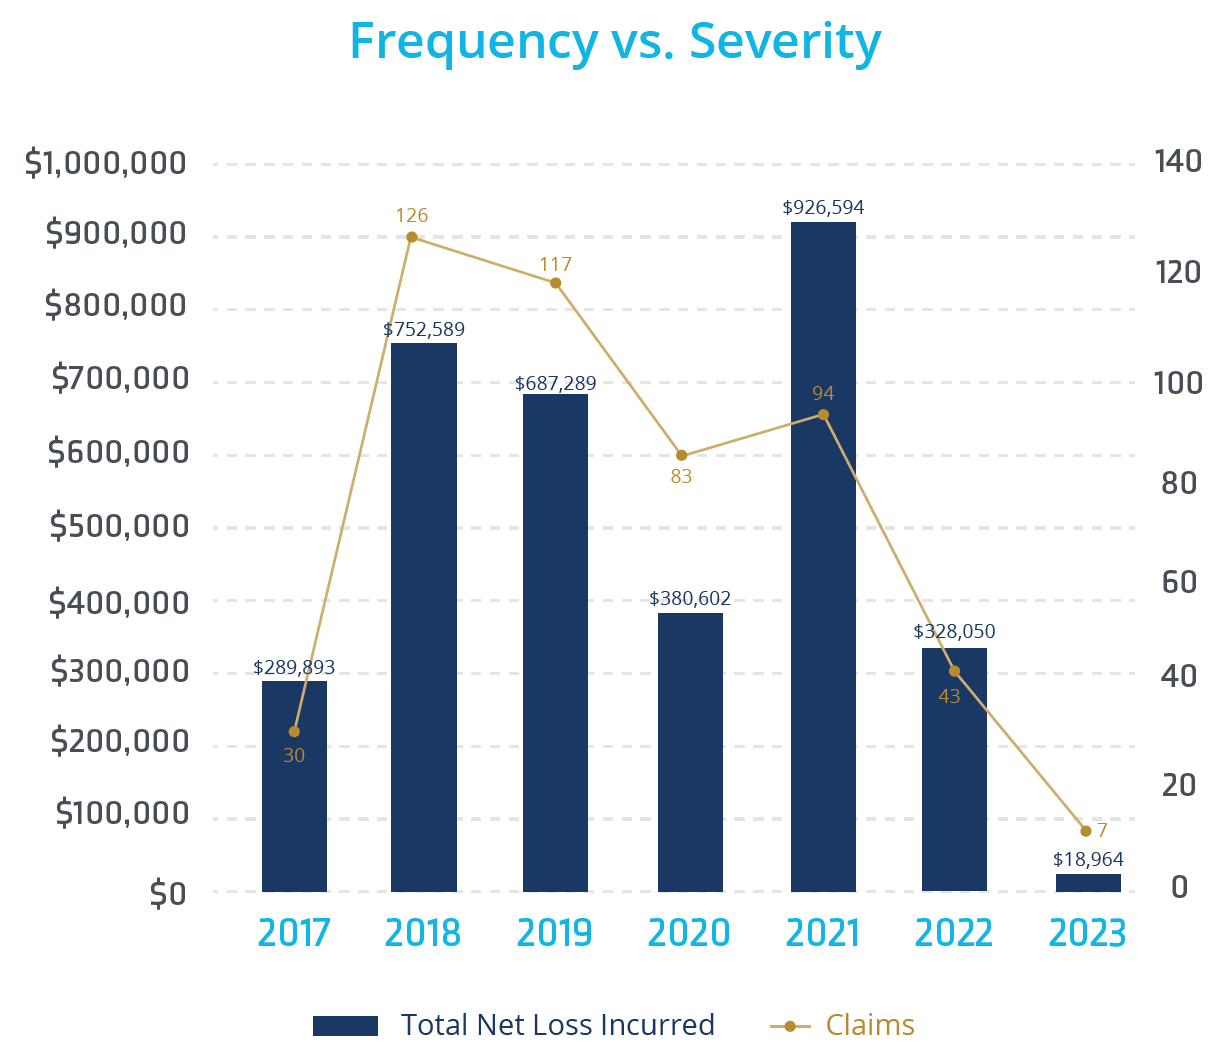
This example reflects seven years of loss data. It compares the total net loss incurred (columns) against the claim counts (line) for 2017-2023. This chart also reflects a current valuation view in which more recent years have yet to develop fully.
Question 1
What is happening with the values for 2023? Do they represent the full year or only part of it? If it’s a partial year, how many months are included?
Question 2
Does this chart display the current valuation for each year, or does it show prior years as of a specific month? For instance, is it comparing August values across all years, or does it present full-year data for 2017-2022 while 2023 only covers a partial year?
Question 3
What factors in 2018 led to a significant increase in claim counts, and what changes in 2022 resulted in a significant reduction in claim counts over the prior years?
Data isn’t just about numbers; it’s about context and understanding the nuances behind the information. A deep familiarity with how your data is collected, processed, and analyzed is essential for uncovering meaningful insights and opportunities. By crafting a robust data strategy, businesses can align their improvement efforts with their overarching goals. This targeted approach not only enhances the effectiveness of initiatives but also helps in managing risks more effectively. Ultimately, when you can accurately convey the story your data tells, you empower stakeholders to make informed decisions. This comprehensive understanding fosters a culture of strategic thinking and continuous improvement, leading to more successful outcomes overall.
Contact an experienced risk advisor for a thorough review and analysis of your organization’s loss data.
 Emerging Liability Exposures in Advanced Manufacturing: AI and Robotics
Jul 6, 2026
Emerging Liability Exposures in Advanced Manufacturing: AI and Robotics
Jul 6, 2026
 Emerging Liability Exposures in Advanced Manufacturing: Plastics Production
Jul 6, 2026
Emerging Liability Exposures in Advanced Manufacturing: Plastics Production
Jul 6, 2026
 Hidden Risks Reshaping Energy M&A Outcomes
Jun 29, 2026
Hidden Risks Reshaping Energy M&A Outcomes
Jun 29, 2026
 Hidden Costs of Deferred Maintenance in K-12 Schools
Jun 15, 2026
Hidden Costs of Deferred Maintenance in K-12 Schools
Jun 15, 2026