The real estate market continues to show resiliency in the face of a fluctuating economy. The property market is softening in most areas, depending on risk exposure and claims histories.1 Broader catastrophe prone areas paint a sobering picture. The relationship between climate risk, insurance availability, and property values is growing. A study by FEMA found that properties within the flood zone in Miami lost as much as 18% in value per square foot. Properties in states with severe catastrophe areas are still realizing challenges in placing rates. Traditional flood risk assessment is proving inadequate as climate patterns evolve. FEMA’s maps are essential tools for identifying flood risks, but they have significant gaps that limit their effectiveness, particularly when it comes to flash flooding from intense rainfall. The disconnect is significant: more than twice as many properties across the country were at risk of a 100- year flood than the FEMA maps identified.2 It takes time to develop and implement a new FEMA Flood Insurance Rate Map, which means many maps across the U.S. may not reflect current land use, urban development or evolving flood risks from extreme weather.
Colorado State University Tropical Meteorology Project (CSU-TC) shifted their Atlantic hurricane season forecasted to be slightly above normal, with a slight decrease in expected activity due to high levels of Caribbean shear that usually indicates a less active season. Yet, the tropical Atlantic sea surface temperatures are warmer-than-normal may still support hurricane formation and intensification and the adjusted forecast still predicts a major hurricanes landfall along the continental U.S. coastline and in the Caribbean.3
Property
As a result, coastal or wildfire-prone areas are experiencing the most significant declines from rate increases over the past few years, adjusting for adequate price.
Areas not prone to natural disasters are now beginning to see rate increases, following years of minimal rate changes, as underwriting performance becomes a greater focus.
Capital providers are optimistic regarding property, pursuing growth and driving competition.4
Shared and layered coverage remains prevalent, particularly for convective storm risks. The domestic excess and surplus lines carriers are very aggressive while London and Bermuda markets are competing with the domestic markets for business. Higher deductibles and self-insuring/self-funding are being utilized creatively to manage risks and costs.
Casualty
General Liability
General liability rates are declining slightly. February rates averaged 3.95%, which was down from 4.19% in January.5
Social inflation remains a factor driving up litigation costs, jury awards, and claims settlements.6
As coverage prices increase in upper towers of coverage, organizations are experiencing unexpected prices and looking to pull back on full coverage limits. This trend seems to be more of a hunt for price savings over strategy, though it increases the organization’s exposure.
Excess Liability
Insurers are scaling back available capacity over concerns about social inflation and growing claims severity.
The excess and surplus market is seeing increased premium year over year and reduction in market share.
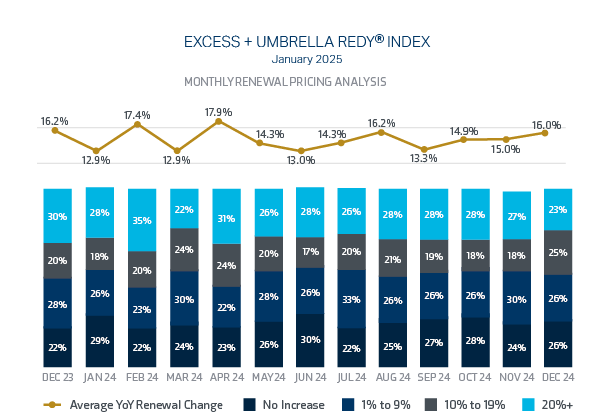
Umbrella premiums rose by 9.5% in Q1 2025, following an 8.7% increase in Q4 2024.7
In 2024, the frequency and severity of nuclear verdicts surged, presenting significant challenges for businesses across various industries. A record 135 cases resulted in verdicts exceeding $10 million, marking a 52% increase from 2023 and the highest level since 2009.9 These verdicts totaled $31.3 billion, reflecting a staggering 116% year-over-year increase, with a median award of $51 million.
Workers’ Compensation
Workers’ compensation decreased an average of 2.6%, highlighting a favorable market with available capacity.
Workers’ compensation continues to drive profitability for the industry as rates have been decreasing steadily for over 15 years, due to improved injury results.
According to NCCI, workers’ compensation combined ratio remained at 86 in 2024, the same as 2023, and marked the eighth consecutive year below 90.10
Cyber
While carriers are taking a longer look at third-party contracts for risk exposure, rates remain competitive and flexible.
Social engineering and ransomware continue to be the most prevalent claims, with AI-powered phishing attacks increasing.
Organizations with strong IT security and privacy policy compliance are benefiting from a stable market.
Carriers are starting to limit their exposure to data/privacy claims if policyholders do not outline a clear cyber-strategy.
Directors and Officers (D&O) Public
Federal Securities Class Action Claims(FSCA) filings slowed in Q2 2025 to a total of 111 from January through June, which represents a rate that is equal to 2024.
Carriers remain cautious regarding companies with near-term capital needs or that have a high likelihood of M&A.
Although D&O litigation remains elevated over historical levels, overall market conditions remain favorable. Capital remains plentiful and pricing is competitive.
Some carriers are struggling to build critical mass, and several have exited the market. Partnering with strong and stable D&O capital providers should be an important consideration.
D&O Federal Securities Class Action (FSCA) claims increased in 2023 and 2024, with a 13% increase from 2022 to 2024.
52% of FSCA settlements approved in 2024 included a derivative action with a median settlement value of $14 million.
Directors and Officers (D&O) Private
Market rates are stable, with the average rate change between 0-5+%
While some rate decreases remain attainable, many markets are trying to hold the line and secure the rate in certain circumstances.
Insureds with clean loss histories, strong controls, minimal changes in exposures, and a consistent pattern of financial performance can still expect favorable renewals.
Less stable risk profiles, such as claims heavy accounts and more challenging industries, are more likely to experience rate increases.
Overall, coverage terms remain favorable for our clients.
General Rate Estimate
Non-CAT exposed property with a favorable loss history
Flat up to 5%
CAT exposed property with favorable loss history
Down 15% to 20%
General Liability with favorable loss history
Up 5% to 25%
General Liability with non-favorable loss history
Up 40%+
Umbrella & Excess Liability
Flat to up 19%
Workers’ Compensation
Down 2.6% to flat
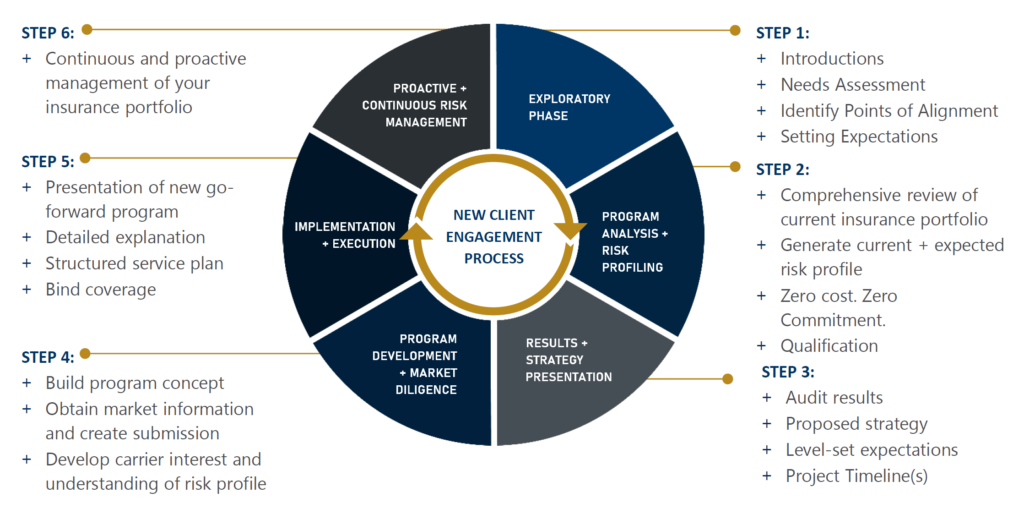
Guidance
Begin the Renewal Process Early
Partner with your broker early to prepare for any challenges and increase greater renewal success within market conditions.
Partner with Industry Experts
It is important to work with your broker’s industry experts who understand the business and the market. Collaborate with a team that can best represent your risk holistically and partner with you.
Prioritize Proactive Risk Management
Work with your broker to develop a comprehensive program that includes coverage analysis, benchmarking, contract reviews, and threat assessments, demonstrating your organization’s commitment to risk management.
Optimize Coverage Across Lines
Review all lines of insurance to ensure comprehensive protection. Balance cost savings with adequate coverage to avoid underinsurance that could expose your organization to significant financial risks.
Engage in Strategic Risk Management
Work closely with your leadership team to align insurance decisions with your organization’s broader risk management strategy. This ensures that coverage supports your business goals while safeguarding against unforeseen challenges.
Contact
Jim Litterer
EVP, National Real Estate Practice Director