Energy Economic Overview & Market Update
Q3 2025
The global energy sector enters the second half of 2025 navigating a complex landscape of record investment levels, shifting capital flows, and evolving demand dynamics that present both opportunities and risks. Global energy investment is expected to reach a record $3.3 trillion in 2025, with clean technologies capturing two-thirds of this capital, at $2.2 trillion, while traditional oil, natural gas, and coal investments are projected to remain steady at $1.1 trillion.1
Despite economic headwinds and softer commodity prices, fundamental demand remains robust. Global oil demand forecast to reach a record 103.7 million barrels per day (mb/d) in 2025, up 1.0 mb/d from 2024.2 U.S. crude oil production is averaging a record 13.5 mb/d year to-date through May, with petroleum demand up 1.0% year-over-year and net petroleum exports averaging 2.9 mb/d.2 Natural gas tells a similar story, with global demand on track for new records of 151.4 trillion cubic feet (tcf) in 2025.2
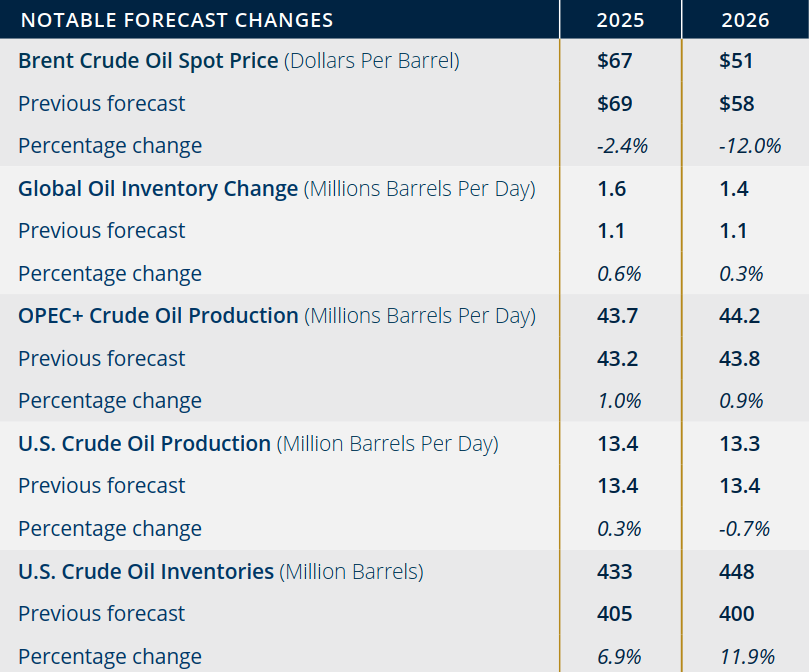 Note: Values in this table are rounded and may not match values in other tables in this report. Percentages are calculated from unrounded values. The current STEO forecast was released August 12. The previous STEO forecast was released July 8.
Source: Short-term energy outlook, August 2025. U.S. Energy Information Administration2
The artificial intelligence revolution is fundamentally reshaping energy infrastructure requirements and risk profiles. Meta’s 4-millionsquare-foot Hyperion data center in Louisiana, expected to consume up to 5 gigawatts of electricity at full capacity, exemplifies the scale of power data centers may command.3 To meet the expected load of Hyperion, Entergy Louisiana will build three new natural gas plants generating approximately 2.3 gigawatts of power specifically for the facility, and construct transmission lines to handle 1.5 gigawatts of solar capacity.4 Such hyperscale data centers are projected to add 100-200 TWh of power demand annually by 2030, with liquified natural gas (LNG) playing a critical role in providing the necessary generative capacity.5
Because renewables increasingly face grid infrastructure constraints and intermittency issues, LNG-driven firm generation capacity is becoming a critical resource for maintaining power grid resilience and reliability as AI workloads continue to expand.8 Globally, this sector investment in the renewable energy sector remains robust; investment across 27 European countries surged by nearly $30 billion (63%) in 2024, yet the U.S. investment fell $20.5 billion (36%) in the second half of 2024.7 Meanwhile, in the U.S., the LNG market stands at a critical juncture, with nearly295 bcm/yr of new export capacity expected to come online between 2025 and 2030 from projects already under construction—the largest capacity wave in LNG history. While beneficial to projects such as large-scale data centers, increased capacity raises questions about potential oversupply and stranded assets.6
These dynamics create a dual challenge for insurers: supporting energy companies through an unprecedented capital deployment cycle while managing exposures that span from traditional operational risks to emerging concerns around project delays, regulatory shifts, and the financial implications of energy transition strategies. The surge in M&A activity—which tripled to $206.6 billion in 2024 despite lower commodity prices— signals ongoing sector consolidation that may improve overall operational efficiency while also concentrating risks.7
As energy security concerns drive investment decisions following geopolitical disruptions, there will need to be a balance in facilitating critical infrastructure development against the backdrop of narrowing margins.8 The convergence of traditional energy resilience and accelerating electrification demands a sophisticated understanding of both legacy risks and emerging exposures across the entire energy value chain.
The U.S. upstream sector continues to demonstrate remarkable operational efficiency, with crude oil production rising 2% in 2024 despite persistent headwinds from softer commodity prices and reduced drilling operations.9 This resilience, driven primarily by technological advances and capital discipline in tight oil plays, presents both opportunities and evolving risk profiles in supporting exploration and production activities.
Onshore crude oil production in the U.S. Lower 48 states has more than tripled since January 2010, fundamentally transforming the risk landscape for upstream operators.10 The shift from legacy vertical drilling to horizontal tight oil production has been dramatic: tight oil production surged from 0.8 million barrels per day (b/d) in 2010 to 8.9 million b/d in 2024, now accounting for 81% of total onshore Lower 48 oil production.10 Meanwhile, legacy production from conventional vertical wells declined from 2.6 million b/d to 2.1 million b/d over the same period.10
The Permian Basin accounted for nearly half the U.S. crude oil production in 2024, it also represented 65% of all tight oil production growth since 2010 and drove almost all U.S. production growth in 2024.10 This geographic concentration creates both economies of scale for operators and potential aggregation concerns for managing risk exposures across the basin.
A sustained improvement in drilling efficiency has led to improved upstream productivity. According to EIA data from April 2025, three large producing areas in the U.S. lower 48 saw year over-year productivity improvements of 6.6% in the Permian, 6.9% in the Eagle Ford, and 7.0% in the Haynesville.11 These efficiency gains stem from multiple operational enhancements, such as the increased strategy of drilled but uncompleted (DUC) wells. Combined with improved drilling and completion techniques, operators are focusing exclusively on the most productive acreage and leveraging existing infrastructure to maximize output from fewer assets. This optimization strategy, while improving financial returns, concentrates operational activity in high-value areas, potentially amplifying the impact of any single loss event.
The North American midstream sector is experiencing unprecedented expansion driven by surging demand from AI-powered data centers and LNG export facilities. Natural gas pipeline projects completed in 2024 increased takeaway capacity by approximately 6.5 billion cubic feet per day (Bcf/d) from key producing regions, including Appalachia, Haynesville, Permian, and Eagle Ford, while an additional 6.5 Bcf/d of capacity was added specifically to serve LNG export terminals in Texas and Louisiana.12
The scale of infrastructure development underway is substantial. Energy Transfer’s recently approved $5.3 billion Desert Southwest expansion will add 516 miles of 42-inch pipeline and nine compressor stations across Arizona, New Mexico, and Texas, with capacity to transport 1.5 Bcf/d when it enters service, expected in Q4 2029.13 The Permian Basin alone has at least seven natural gas pipelines currently under construction, including WhiteWater’s Blackfin project (2.5 Bcf/d capacity, expected Q4 2025) and Blackcomb project (2.0 Bcf/d capacity, expected Q4 2026).14
Data center proliferation is reshaping midstream investment priorities and geographic focus. Operators in the Marcellus and Utica shale basins report “tremendous growth opportunities” from the national push for electrification combined with AI-driven data center expansion.15 Notably, the longstanding blockade on gas pipeline projects at the New York border was lifted, with previously dead projects like Williams Companies’ Constitution and Northeast Supply Enhancement projects, along with Millennium Pipeline’s expansion, now back under consideration.16
Storage dynamics present additional complexity for midstream operators. U.S. natural gas storage has been replenished, though inventories at the Cushing hub have hovered just above operational levels. Near-term prices have dampened, though futures point to higher prices through winter.
Operators are increasingly leveraging AI and advanced sensors for pipeline monitoring and security.
Regulatory framework revisions needed to enable treated produced water use outside the oil and gas industry are progressing slowly, creating both environmental liability concerns and operational constraints.
Third-quarter resin price projections indicate relative stability with modest upward pressure across all five major commodity resins amid softening domestic and global demand, though pricing trajectories remain vulnerable to significant disruption from geopolitical risks, oil price volatility, trade tensions, and an active hurricane season that could severely impact Gulf Coast production facilities and supply chains.
Major Permian Basin operators are transitioning to using over 90% produced water for hydraulic fracturing operations, fundamentally altering water management risk profiles as companies work to prove environmental safety, maintain operational continuity, and develop innovative treatment technologies.17 The industry’s shift from freshwater dependency to produced water recycling represents both a sustainability imperative and an operational challenge, as inadequate water infrastructure or treatment failures could disrupt production while creating environmental liabilities.
The U.S. plastics industry demonstrated resilience in the second quarter of 2025 with shipments increasing 3.5% compared to the same period in 2024, while machinery trade showed divergent trends— imports declining 7.9% quarter-over-quarter despite a 1.9% year-over-year increase, and exports rising marginally by 0.4% from the previous quarter but falling 4.3% annually.18 Industry sentiment has moderated a bit with more than half of manufacturers expecting steady or improving conditions over the next 12 months, down from 62%. Business activity has strengthened, suggesting near-term operational stability despite ongoing tariff uncertainties affecting long-term strategic planning.
In response to renewable energy’s unique risk profile, companies are turning to parametric insurance products as a way to cover gaps in traditional coverages. Within the renewable sector specifically, parametric products are outpacing traditional offerings, and this market is forecast to grow globally from $15.99 billion in 2025 to $34.62 billion by 2032—a 10.21% CAGR.19 While renewable energy companies look at this form of insurance as a way to protect their assets against climate risks, parametric can also address fundamental vulnerabilities, such as cloudy or windless days.20
Real-world applications demonstrate both the potential and limitations of parametric coverage. A 2025 analysis found that projects with parametric layers saw a 20% reduction in debt service coverage ratio (DSCR) requirements.21 In Texas, solar farms with hail-parametric triggers recovered 80% of losses from a 2022 hailstorm, compared to only 38% under traditional policies.22 However, basis risk remains a significant concern—the possibility that losses occur without triggering the parametric threshold, or that payouts inadequately cover actual damages.
The renewable energy sector continues to expand capacity even as governmental headwinds increase. The EIA expects the electric power sector to add 26 GW of new solar capacity in 2025 and 22 GW in 2026, following a record 37 GW of solar installations in 2024.23
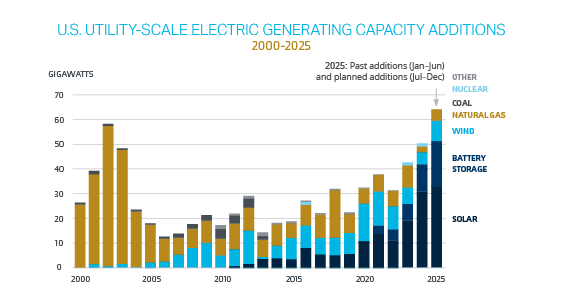
Data Source: U.S. Energy Information Administration, Preliminary Monthly Electric Generator Inventory, June 2025
Source: U.S. developers report half of new electric generating capacity will come from solar. August 2025. U.S. Energy Information Administration24
Battery storage capacity is experiencing unprecedented growth alongside solar expansion, fundamentally altering grid dynamics. Battery storage accounted for the second-largest share of capacity additions in the first half of the year, at 26% (5.9 GW), about half of which was in Arizona or California. The EIA forecasts a record 18.2 GW of utility-scale battery storage additions in 2025, representing a 70% increase from the 26 GW of cumulative capacity installed through 2024.25
The energy industry enters a pivotal moment as traditional and renewable sectors converge around new infrastructure demands while facing fundamentally different risk trajectories. Record production levels across oil and gas operations coincide with accelerating renewable deployments and surging power demand from artificial intelligence applications, creating an unprecedented scale of capital deployment that requires sophisticated risk management approaches. This convergence represents both opportunity and challenge as familiar operational risks in established sectors blend with emerging exposures in rapidly evolving technologies.
The transformation extends beyond simple capacity additions to reshape entire value chains. Upstream efficiency gains alter loss profiles as fewer, more productive assets carry greater individual exposure. Midstream expansion struggles to keep pace with production growth and new demand centers, creating bottleneck risks. Downstream consolidation through refinery closures shifts dependencies toward imports and elongated supply chains. Meanwhile, the renewable sector’s weather-dependent operations introduce volatility that traditional indemnity models cannot adequately address, driving innovation in parametric products and alternative risk transfer mechanisms.
Looking forward, the insurance industry must balance its critical role in facilitating energy infrastructure development against managing increasingly complex and interconnected risks. Geographic concentration, technology uncertainties, regulatory shifts, and climate volatility all demand new underwriting approaches and portfolio strategies. Success will require insurers to maintain deep technical expertise across traditional and emerging energy sectors while developing innovative products that address gaps in conventional coverage, ultimately supporting the industry’s dual mandate of energy security and transition.
Stephanie Crochet
Director, National Energy Practice
Austin Struble
Vice President, Energy
Rylee Gale
Account Executive
Amber Bonin
Commercial Lines Leader, Energy
Sharon Burger
Senior Vice President, Environmental Practice
Daniel Posnick
Transactional Liability Leader, Executive Risk
Donnie Steil
Risk Control Practice Leader, Energy
Angela Thompson
Senior Marketing Specialist, Market Intelligence & Insights
Brian Spinner
Senior Marketing Coordinator, Market Intelligence & Insights