Education Insurance Pricing & Market Update
Q4 2025
Educational institutions are navigating a complex mix of internal pressures, external forces, and emerging risks that influence every strategic decision across the sector. Shrinking budgets, declining enrollment, staffing shortages, and escalating compensation demands—combined with rising property costs, rapid technology shifts, and evolving regulations—are converging to create a highly challenging environment that threatens the future of education.
Operational costs are increasing faster than inflation, while tuition revenue remains variable. Timing creates a particular vulnerability when enrollment projections are missed or unexpected mid-year expenses arise. Issues such as mid-year student transfers to temporary closing facilities have caused private K-12 schools to struggle with operating income and reporting business income. Schools face uncertainty over whether to classify the issue as a business loss under current reporting requirements. Many miscalculate business income by relying solely on annual tuition figures, overlooking additional expenses and the timing of when tuition is collected and earned. Inaccurate or delayed financial reporting often hinders timely corrective action.
Higher education institutions face budget challenges due to enrollment shortfalls, particularly among international students, which necessitate cuts in programs and departments, staffing reductions, and operational reductions and directly affect educational missions.
A decline in enrollment signifies a significant risk for educational institutions. This enrollment shift and decline are creating a demographic squeeze throughout all levels of education. This is a concern for private K-12 institutions, where tuition is often the primary source of income. While the total number of K-12 students is decreasing, studies suggest the effect is more profound in public schools than in private or charter schools.

Note: Public and charter school figures include students in prekindergarten through 12th grade. Private school data includes pre-K students in schools that offer kindergarten or a higher grade.
Source: U.S. public, private, and charter schools in 5 charts1
Through 2021, estimates suggest that private school enrollment rebounded from the decline just ten years earlier, while charter schools have seen steady growth since 2011. It remains challenging to track private school enrollment, making it difficult to determine overall K-12 student enrollment. Census data shows 11.8% of U.S. students attended private schools in 2022, though finding reliable current data remains challenging compared to public school enrollment tracking.2 While 46% of private schools reported enrollment increases over 2022-2023, retaining these families remains difficult amid tuition increases and economic uncertainty.3 Higher education is facing similar pressures, including reduced foreign student enrollment, further impacting the sector.
Teacher and staff shortages represent a crisis affecting learning quality, operational costs, and institutional stability across all education sectors. Forty-five states reported special education teacher shortages in 2024-25, and the labor market remains challenging, with difficulty finding qualified educators and the cost of hiring new educators continuing to grow rapidly.4
Often, these shortages require schools to hire uncertified teachers, rely on substitutes, increase class sizes, or cancel courses, undermining student achievement and creating potential risk exposures. The costs are substantial, ranging from $12,000 to $25,000 per teacher who leaves. And, benefit costs, including pensions and health insurance, are rising faster than inflation. Staffing shortages in special education are particularly acute and have led to increased litigation between districts and families over missed services.
While there has been some plateauing in property rates for educational institutions, it is not the dramatic decline in rates or terms and conditions seen in other industries or at the reinsurance level. Many institutions are covered in the standard property market, which remains fairly challenging, and expectations are for single-digit rate increases in 2026.
Catastrophic events are also fueling challenges in property coverage. The Southern California wildfires last January demonstrated that the property market as a whole was undervalued by approximately 50%. Beyond named storms, significant wind, hail, and wildfire exposures have generated substantial claims over the past 12 months. The 2024 flooding in North Carolina caused severe damage to several college campuses that remained closed for months. As carriers review property, institutions should expect renewal pricing to be based on the updated valuation, which affects insurance rates and replacement costs.
These catastrophic losses are driving property insurers to scrutinize replacement cost valuations more carefully and demand higher premiums. The insurance implications extend beyond premium increases—rising construction costs mean that underinsured properties face potentially devastating gaps in coverage when losses occur.
Technology presents both opportunities and significant risks for educational institutions. Artificial intelligence offers potential benefits for classroom instruction and administrative efficiency, yet also raises concerns about academic integrity, data privacy, and the replacement of authentic educational experiences with AI-generated content.
Cybersecurity threats represent a more immediate and costly concern. Education remains among the most targeted industries for attacks; 80% of school IT professionals reported an increase in ransomware attacks in the last year, up from 56% in 2022,5 and cyber-attacks were up 47% in Q1 2025. The 2023 MOVEit breach exemplified third-party vulnerability, affecting numerous educational institutions, including the National Student Clearinghouse, when hackers exploited file-transfer software, exposing sensitive student data such as names, birth dates, and Social Security numbers.
The regulatory landscape for educational institutions is shifting in contradictory directions. For K-12 private schools, some states are relaxing restrictions and expanding school choice programs through vouchers and tax credits. However, these programs create enrollment and financial uncertainty for both private and public schools, as funding follows students in unpredictable patterns.
Simultaneously, curriculum scrutiny is intensifying for both K-12 and higher education institutions. Schools face increased oversight regarding what is taught and how educational content is delivered, creating potential compliance challenges and liability exposures. The U.S. Department of Education continues outsourcing program management to other agencies, potentially creating additional administrative complexity and compliance requirements for educational institutions.6
These regulatory shifts compound existing challenges as schools must adapt to changing requirements while managing financial constraints, enrollment volatility, and operational pressures. The divergent regulatory trends—deregulation in some areas, increased scrutiny in others—create uncertainty that affects institutional planning and risk management strategies.
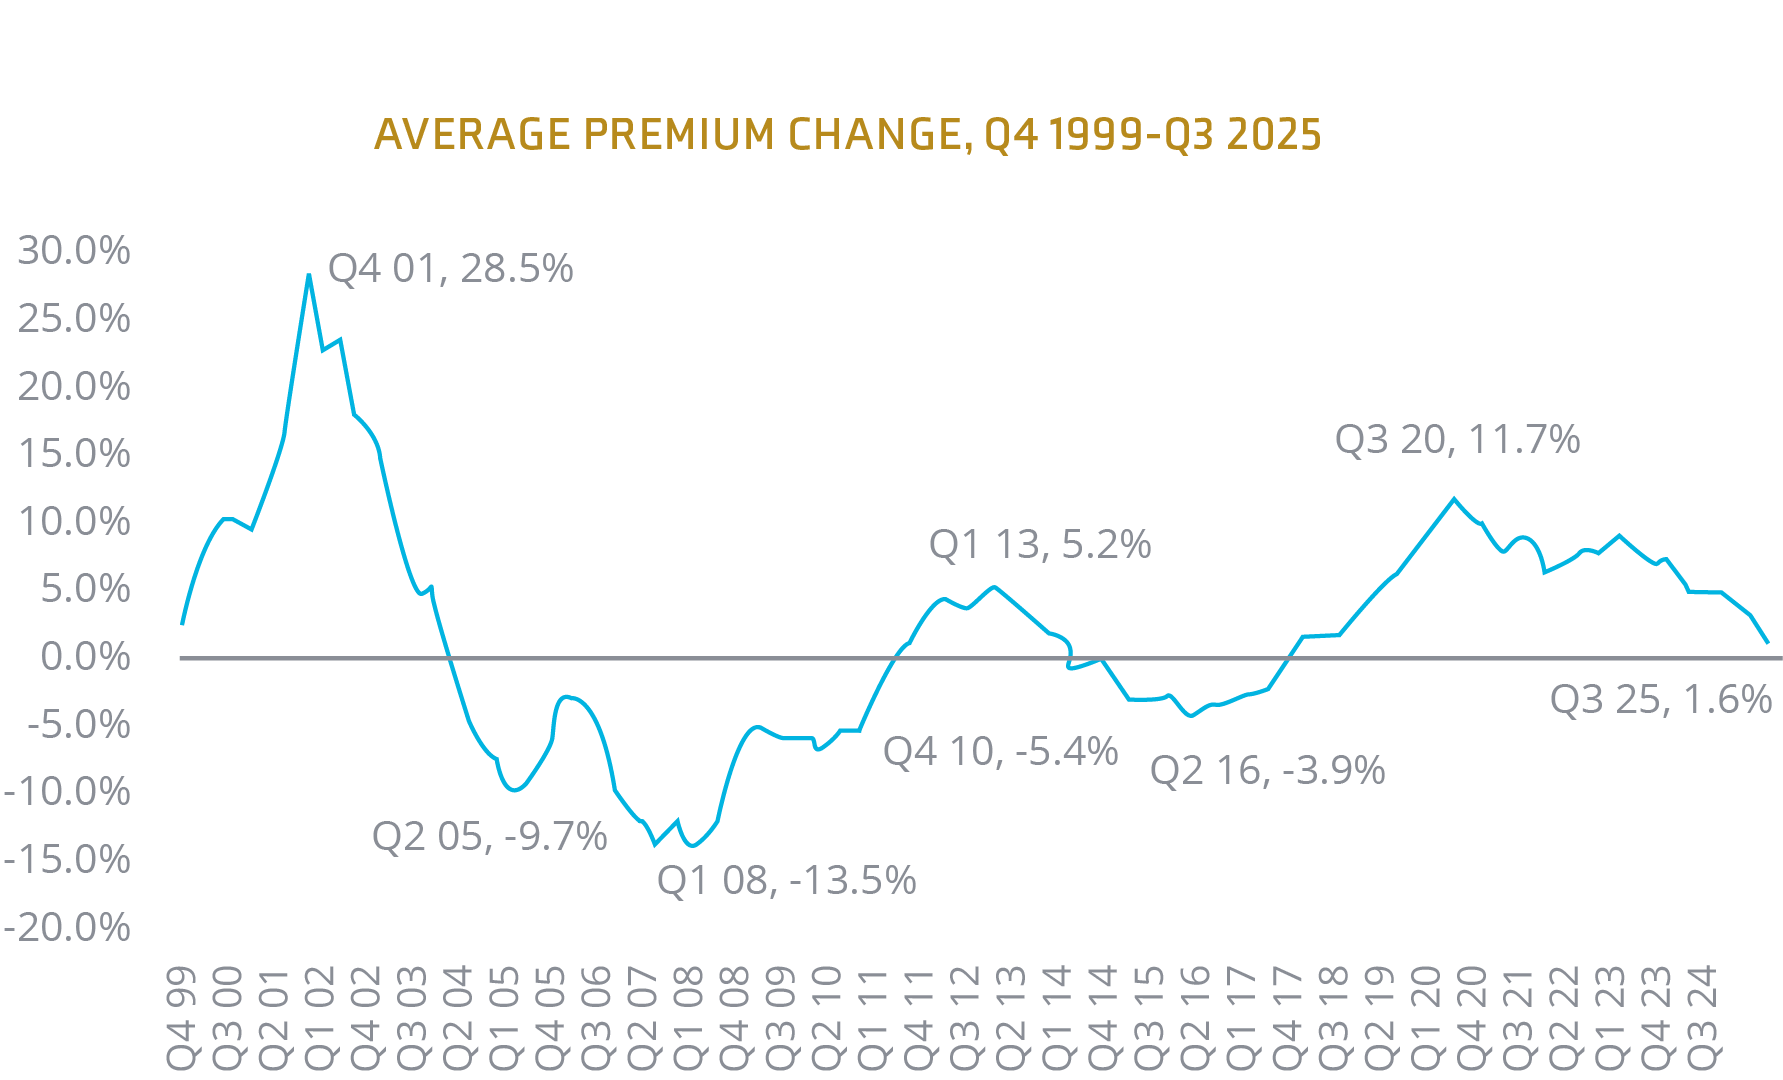
Source: CIAB Commercial Property/Casualty Market Index Q3 20257
While property insurance across many industries is experiencing a softer market, this is not the case in education. The standard market remains challenging, with carriers looking at location and loss history. Many school properties are likely undervalued, which could also lead to higher premiums even if rates fall or remain unchanged.
Social inflation continues to be a significant burden. Enrollment and staffing issues will drive rates, especially when carriers consider business income and liability. Technology is driving change and creating risks, especially with third-party exposures.
General Liability
Excess Liability
Auto
Workers’ Compensation
Cyber
There is increased competition in this space, but rates have risen as well. Technology-related risks are under greater scrutiny, particularly third-party risks. The MOVEit breach continues to haunt the industry. As AI becomes more deeply embedded into operations and classrooms, ethical concerns such as bias, privacy, and security are emerging.
As we look ahead, market conditions continue to evolve across multiple lines of coverage. While pressures such as social inflation persist, their impact varies by coverage and individual risk profile. Enrollment and staffing challenges are influencing liability, workers’ compensation, and business income exposures. At the same time, ongoing technology advancements, though largely beneficial, are introducing new areas of exposure, particularly related to third-party vendors and data security, requiring carriers to adapt underwriting approaches. Property rate expectations remain mixed, with outcomes ranging from modest decreases to more noticeable increases depending on location, values, and catastrophe exposure. Liability lines, including general liability and educator’s legal liability, are expected to see continued, though measured, upward rate adjustments. Understanding these trends supports thoughtful planning, budgeting, and risk-management decisions in the year ahead.
| Property Standard | 4% to 30%+ |
| Property E&S (CAT) | -5% to 5% |
| General Liability (GL) | 8% to 25% |
| Educator’s Legal Liability (ELL) | 8% to 30% |
| Excess Liability | 8% to 20% |
| Automobile | 8% to 15% |
| Workers’ Compensation (WC) | -5% to 5% |

Partner with your broker early to prepare for any changes to increase greater renewal success.
It is important to review, update, and confirm your statement of values (SOV). Ensure your SOV reflects accurate property details and updates. This is crucial as property insurance constitutes a significant portion of your premium. Carriers are keen on accurate valuations, with construction costs rising due to inflation.
It is crucial to work with your broker’s industry experts, who understand the nuances of risk for educational-based institutions and the market when placing the specific risk. Collaborating with a team that can best represent your institution and partner with you is more critical than ever in this disciplined market.
We have a team solely dedicated to helping your institution manage cyber risks. We offer expert assistance, including coverage analysis, financial loss exposure benchmarking, contract language review, in-depth cyber threat analysis, and strategic development of comprehensive, high-value cyber insurance programs.
Engage loss control teams before a claim begins by establishing robust loss control and risk mitigation with the help of your broker. We collaborate with you to understand your financial goals and operational challenges so we can help you identify, develop, and deliver risk control solutions that strategically mesh with your objectives and round out your risk management strategies to complement your insurance program.
Derek Karr
National Education Practice Director
Debra Rosas
Vice President, Education Practice
Angela Thompson
Marketing Strategist, Market Intelligence & Insights
Brian Spinner
Senior Marketing Coordinator, Market Intelligence & Insights