ConstructionEconomic Overview & Market Update
Q4 2025
The construction industry faces a mixed outlook. Total spending declined 2.8% year-over-year, driven by continued weakness in residential (-5.1%), while nonresidential remains strong, supported by data center projects and infrastructure growth in the U.S. South. Public construction spending has surged 43.6% over three years, despite the recent government shutdown, underscoring sustained investment in infrastructure. Rising material costs—especially copper and natural gas—are pressuring budgets, though falling crude petroleum prices offer some relief. Labor conditions remain tight, with residential employment down 0.8% and wages up 3.7%, signaling cost pressures. Backlogs are stable (+0.3% YoY), and project stress indicators are easing, but the Architectural Billings Index remains below 50, pointing to potential future slowdowns. Despite challenges from inflation, labor shortages, and economic uncertainty, strong public spending and large-scale nonresidential projects provide a foundation for cautious optimism.
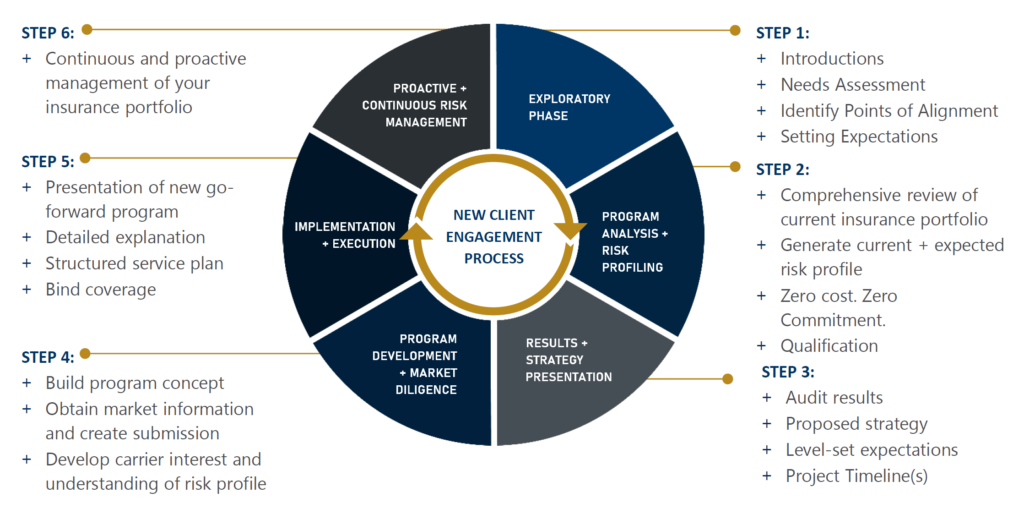
To provide a comprehensive view of the construction economy, current conditions are reviewed through current spending, labor conditions, and material costs, followed by indicators that offer insight into future trends. Forward-looking measures include backlog, construction starts, ConstructConnect’s Project Stress Index, and the Architectural Billings Index. Total construction spending is broken down into key segments, recognizing that not all contractors benefit equally across categories.
While overall year-over-year spending has shown gradual growth, individual categories display varying trends both on an annual basis and across rolling 12-month periods.
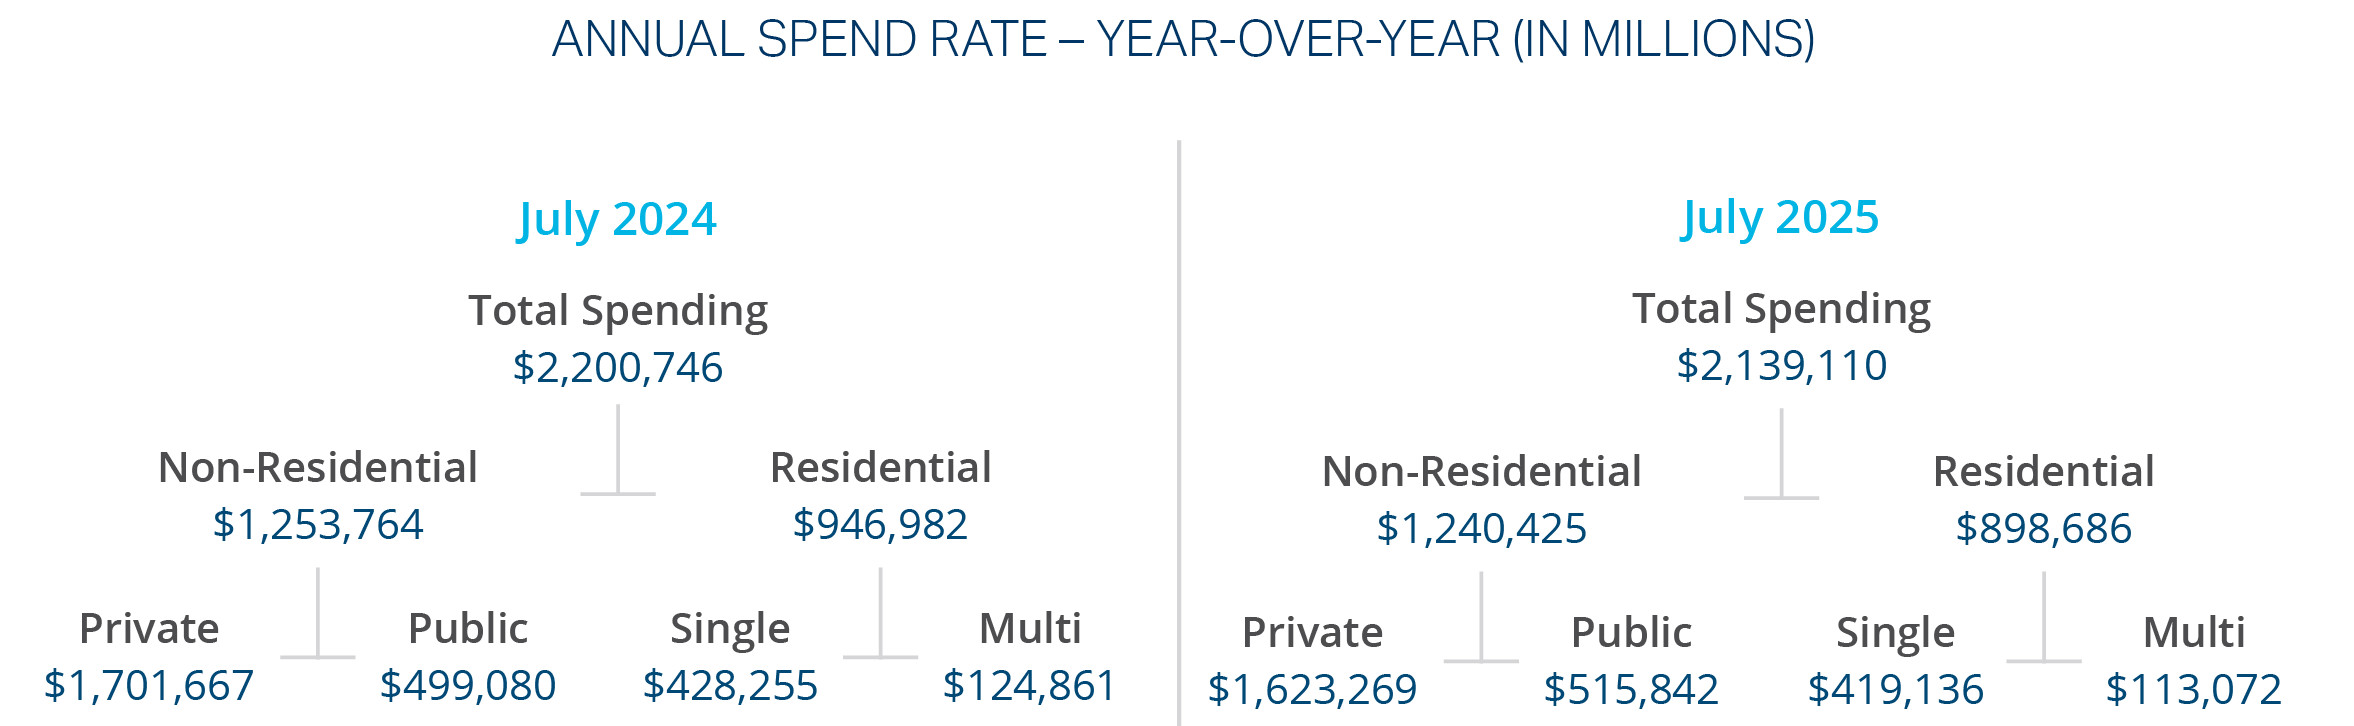
Total construction spending declined 2.8% year-over-year in June. Nonresidential starts posted a modest 2.9% increase compared to last year, while residential starts fell sharply by 18.5% year-over-year. Both sectors also recorded month-over-month declines in July 2025, signaling near-term headwinds.
Data centers remain a bright spot, with starts surging as new projects break ground. However, despite the continued strength of the data center boom, concerns over tariffs and labor shortages are creating uncertainty for the broader construction outlook.2
Nonresidential spending in the U.S. remains elevated compared to 2023 and earlier periods, but overall construction spending has trended downward on a year-over-year basis. According to FRED data, residential spending from July 2024 to July 2025 shows a clear decline, reinforcing the slowdown in this segment.3
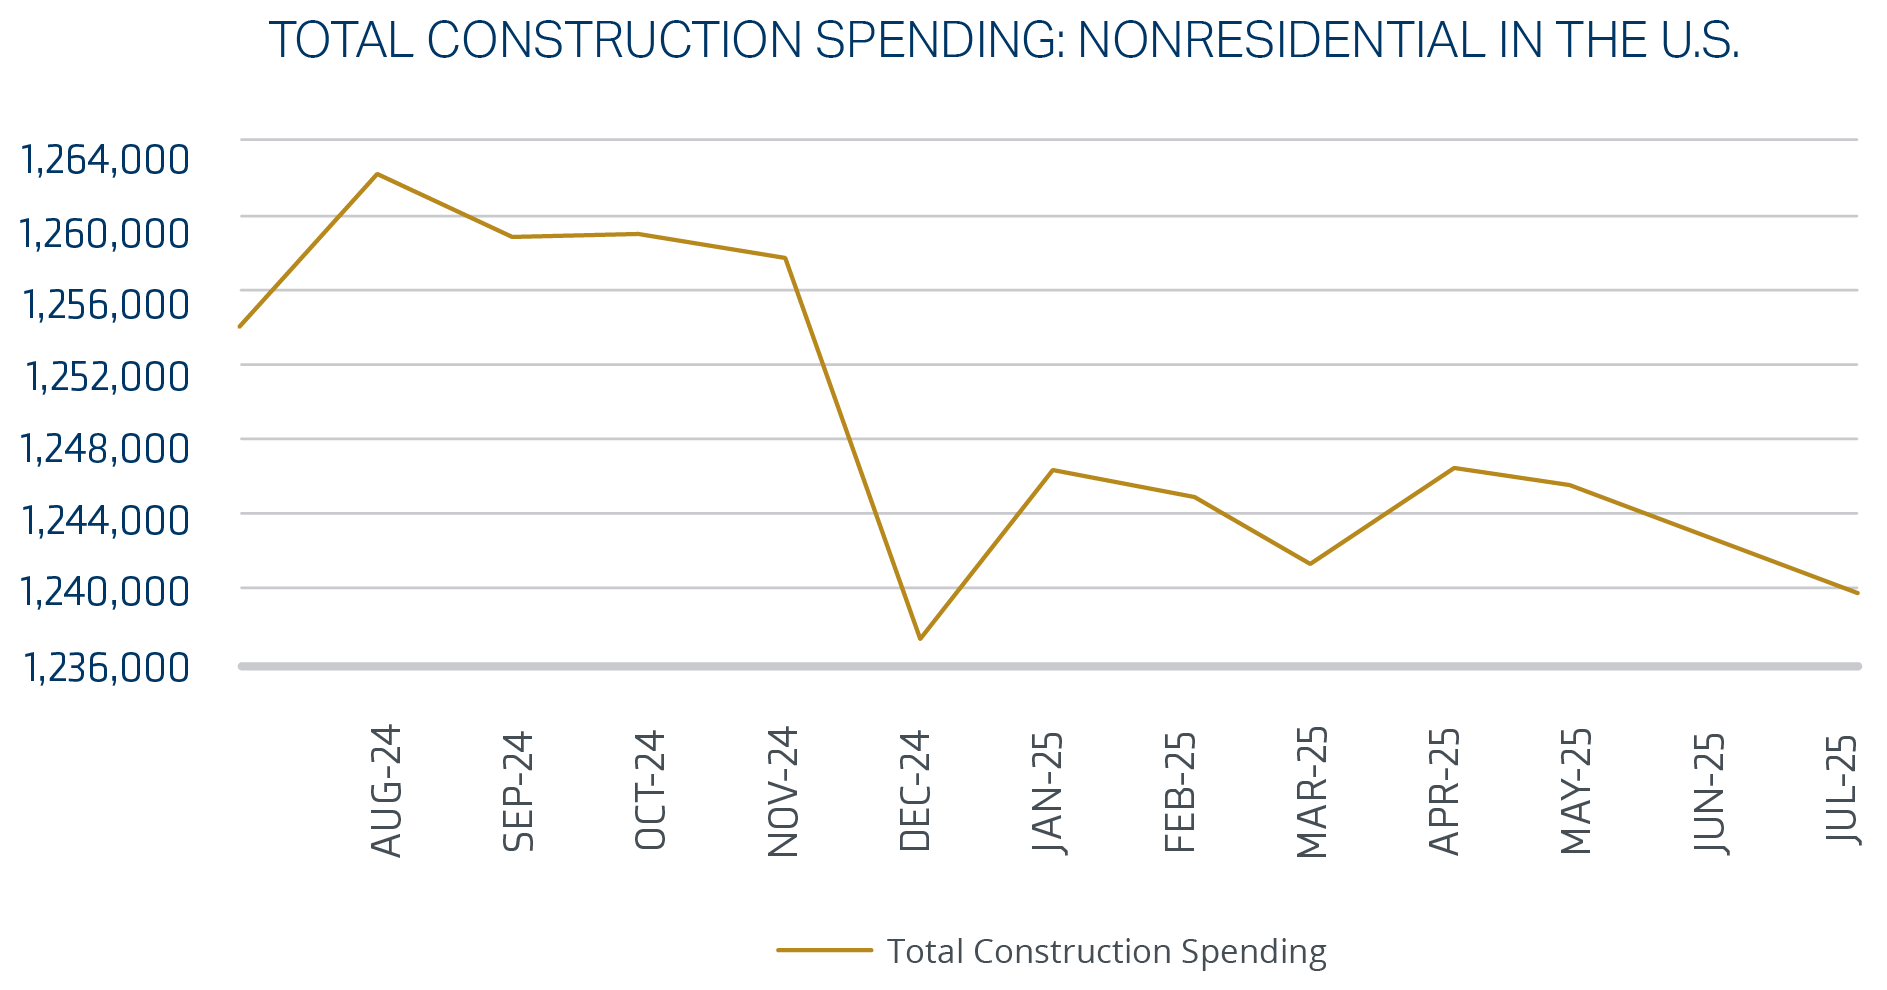
Total construction spending has been trending downward, despite a brief uptick in April 2025 for both overall and nonresidential activity. Material costs have risen faster than anticipated—even with tariff impacts—creating pressure on project budgets. These increases can directly influence job site valuations and insurance exposure, as escalating material costs risk outpacing original budgets. Overall, the longer the delays, the more expensive material costs and labor become.
Regionally, the U.S. South is projected to generate $293.7 billion in 2025 nonresidential construction starts. Civil construction dominates this growth, driven by infrastructure demands. Military and government projects are also expected to rise, while industrial construction appears to be stabilizing following the surge in plant expansions.
At midnight on October 1, 2025, the U.S. government entered a shutdown after Congress failed to reach a funding agreement. Leading up to the shutdown, public construction spending showed modest growth overall, with July’s seasonally adjusted annual rate estimated at $515.8 billion, up 0.3% from June’s revised figure of $514.3 billion. Within key sectors, educational construction registered a slight decline to $111.7 billion, down 0.1% from June, while highway construction mirrored this trend, slipping to $142.8 billion, also down 0.1%.1 These figures underscore a relatively stable but cautious investment environment prior to the disruption, with incremental gains in total spending offset by stagnation in critical categories such as education and infrastructure.
Over the past three years, public construction spending has grown significantly, with a 43.6% increase overall and a 7.4% year-over-year change. Government spending continues to support overall construction activity, even given the government shutdowns.
Some impact on total public construction spending may be expected in the coming months, but a yearly decline appears unlikely.
| 2021 | 2022 | 2023 | 2024 | 1-Year Percent Change | 3-Year Percent Change |
|---|---|---|---|---|---|
| 352,179 | 392,877 | 470,539 | 505,804 | 7.4% | 43.6% |
Source: Data compiled from Federal Reserve Bank of St. Louis. Total Public Construction Spending in the United States. September 2020 -September 2025.4
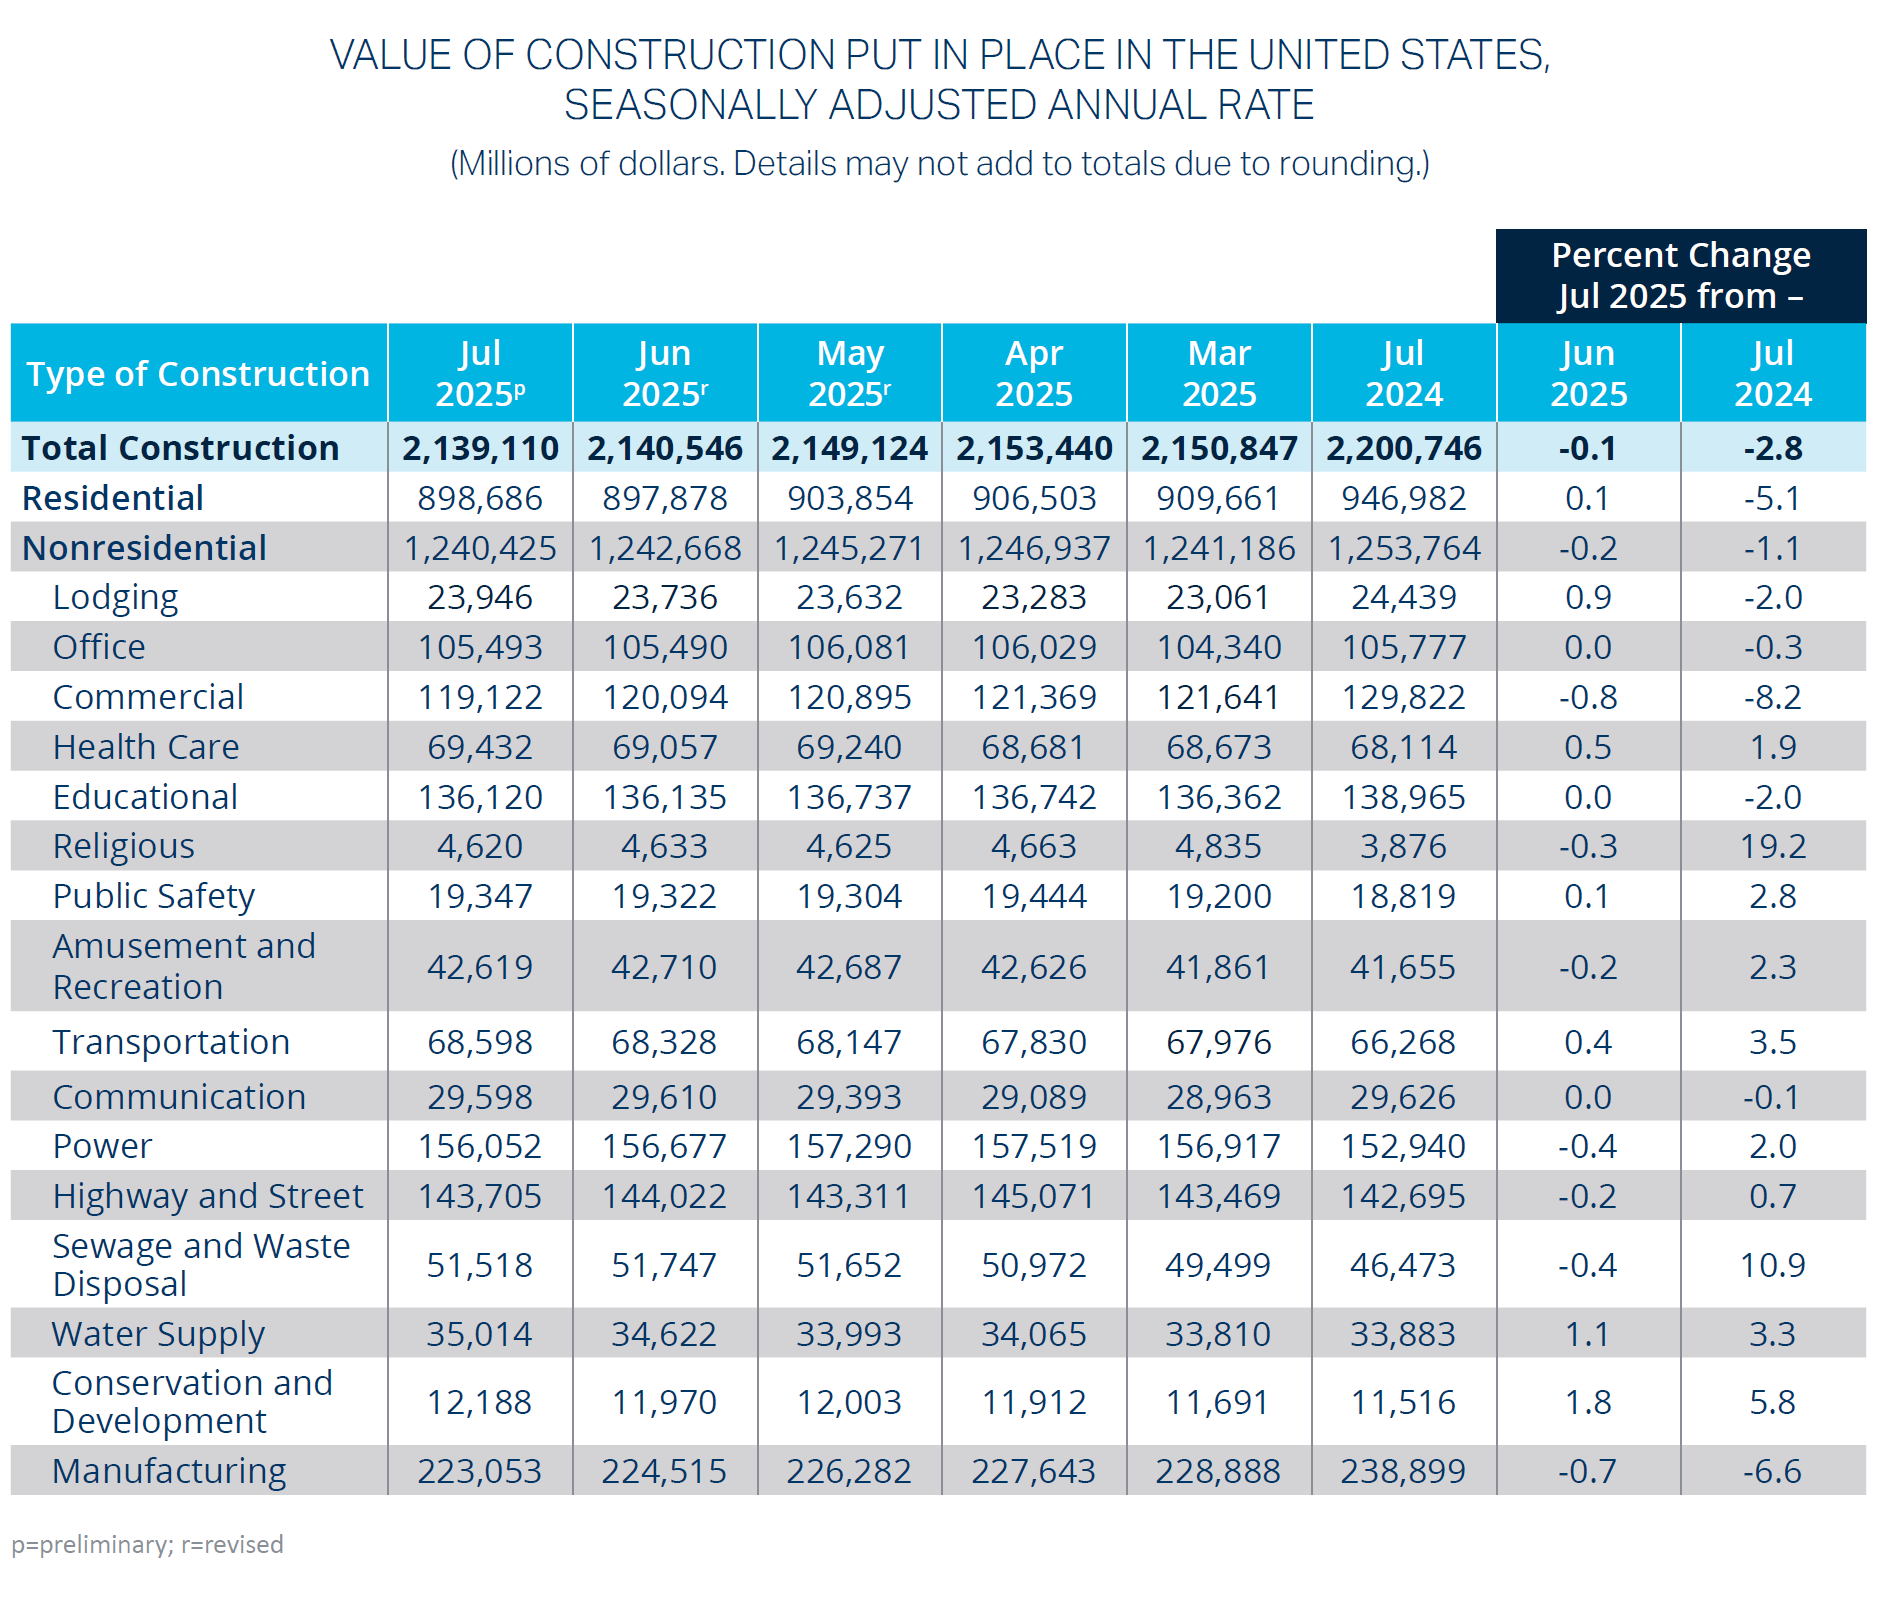
Residential spending has been on a downward trajectory since February, signaling a cooling in this segment of the market. Residential construction spending declined by 5% from July 2024 to July 2025. Between July 2025 and July 2024, rates fell 5.1%, reinforcing the trend of contraction. The updated figures for June came in slightly higher than forecasted, indicating that actual put-in-place construction exceeded initial estimates—a sign of short-term resilience despite the broader slowdown.
| Put-in-Place | Jul 2024 | Jul 2025 | % Change |
|---|---|---|---|
| Total Residential | 946,982 | 898,686 | -5.1% |
| New Single Family | 428,255 | 419,136 | -2.1% |
| New Multifamily | 124,861 | 113,072 | -9.4% |
| Public | 10,355 | 12,153 | 17.4% |
Source: Data compiled from US Census Bureau. Value of Construction Put in Place in the United States, Seasonally Adjusted Annual Rate. Data as of July 2025. Release date September 2, 20251
Residential construction employment has declined, while overall construction employment growth remains modest—up less than 1% year-over-year. The change observed in August was minimal when compared to the prior year’s performance, indicating a continued softening in residential activity. This decline is largely driven by a reduction in residential specialty trade contractors (STC), as increasing retirement and a widening generational knowledge gap limit the availability of skilled labor in the marketplace.
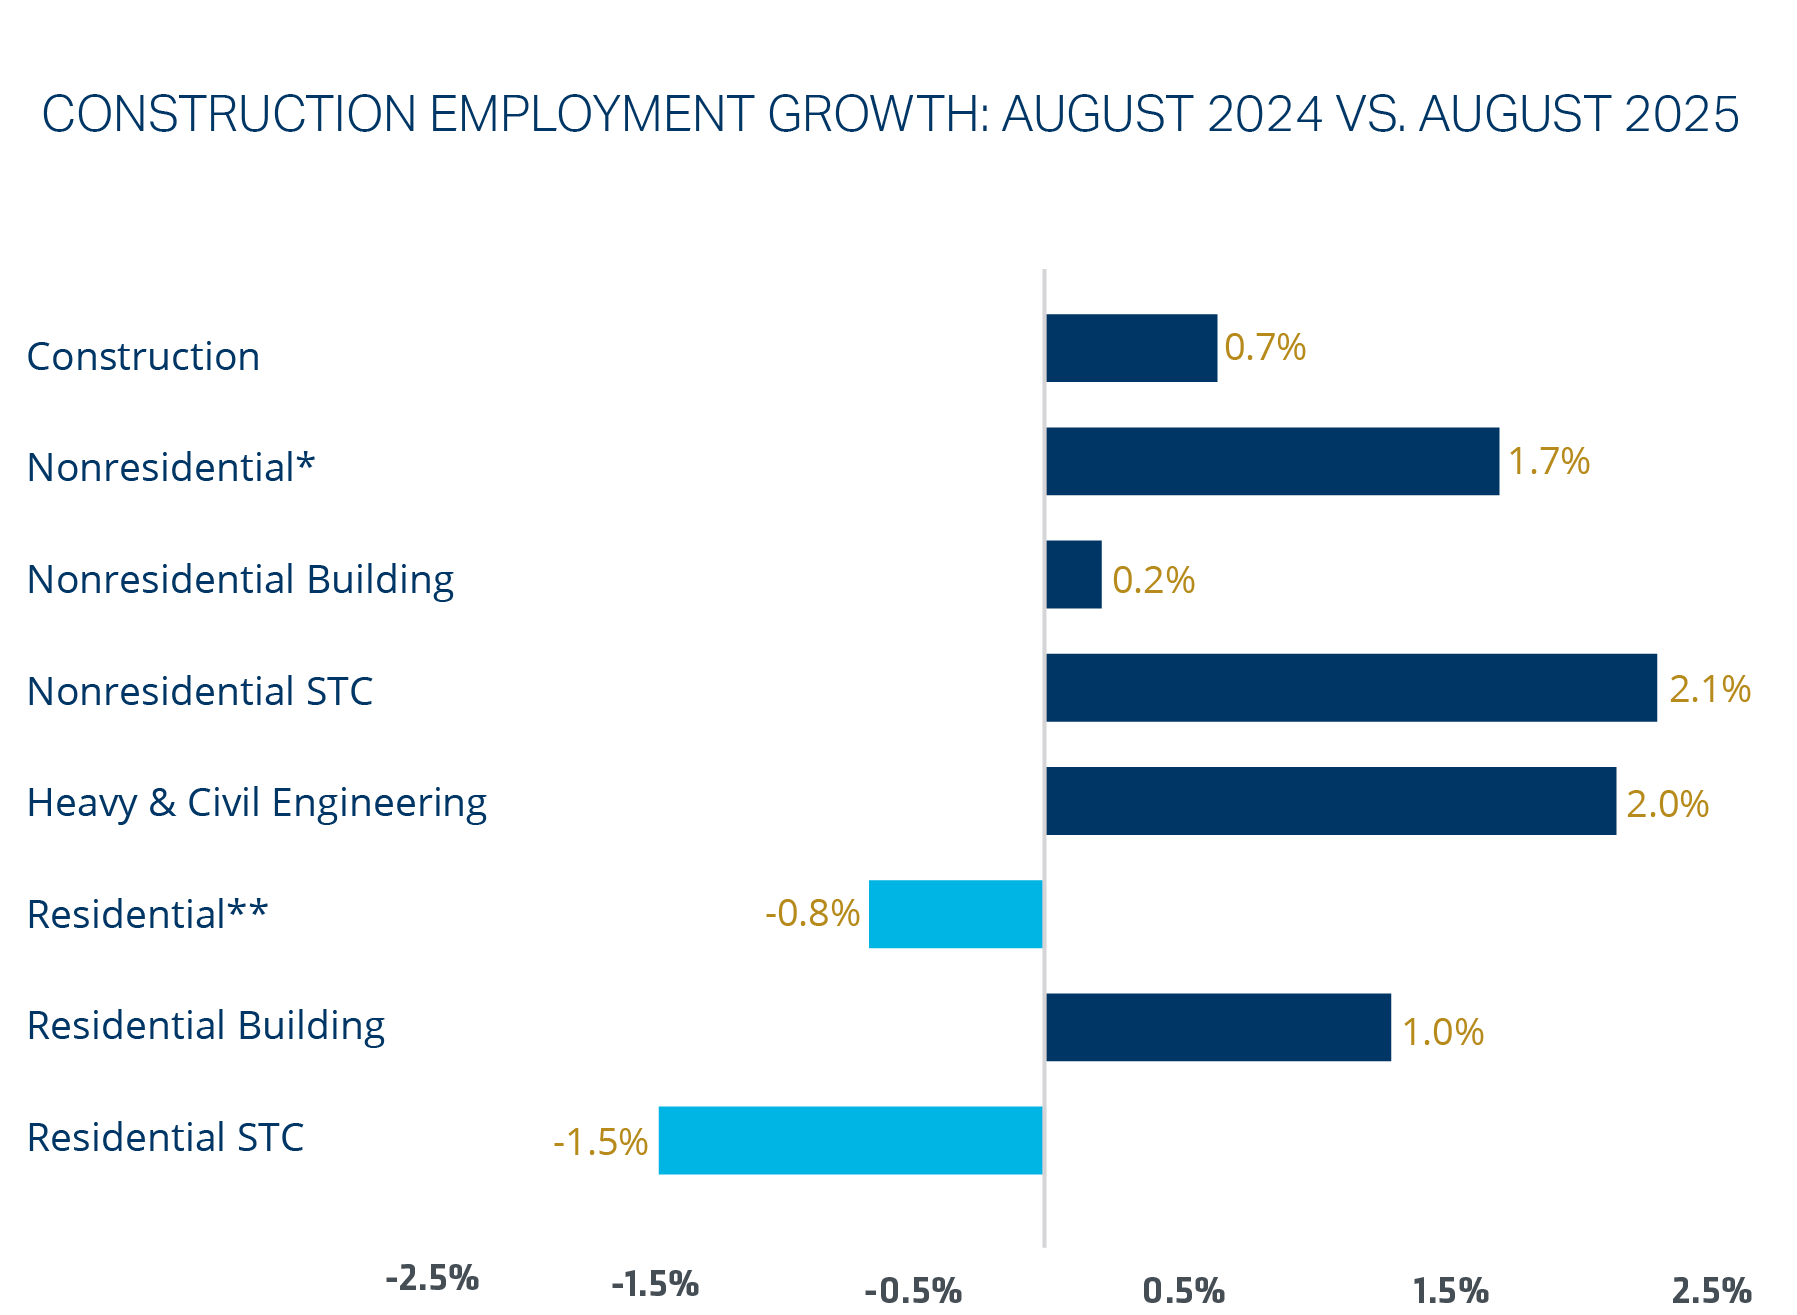
Residential employment has been trending downward gradually over the past 12 months. In contrast, nonresidential construction employment has shown consistent growth over the same period. Despite the divergence between sectors, total construction employment continues to trend upward.
Average weekly hours worked have decreased year-over-year, as of August 2025. However, average hourly earnings have increased by 3.7% over the same period. This suggests a tightening labor market, where wage growth is outpacing hours worked, potentially reflecting shifts in labor demand and project scheduling.
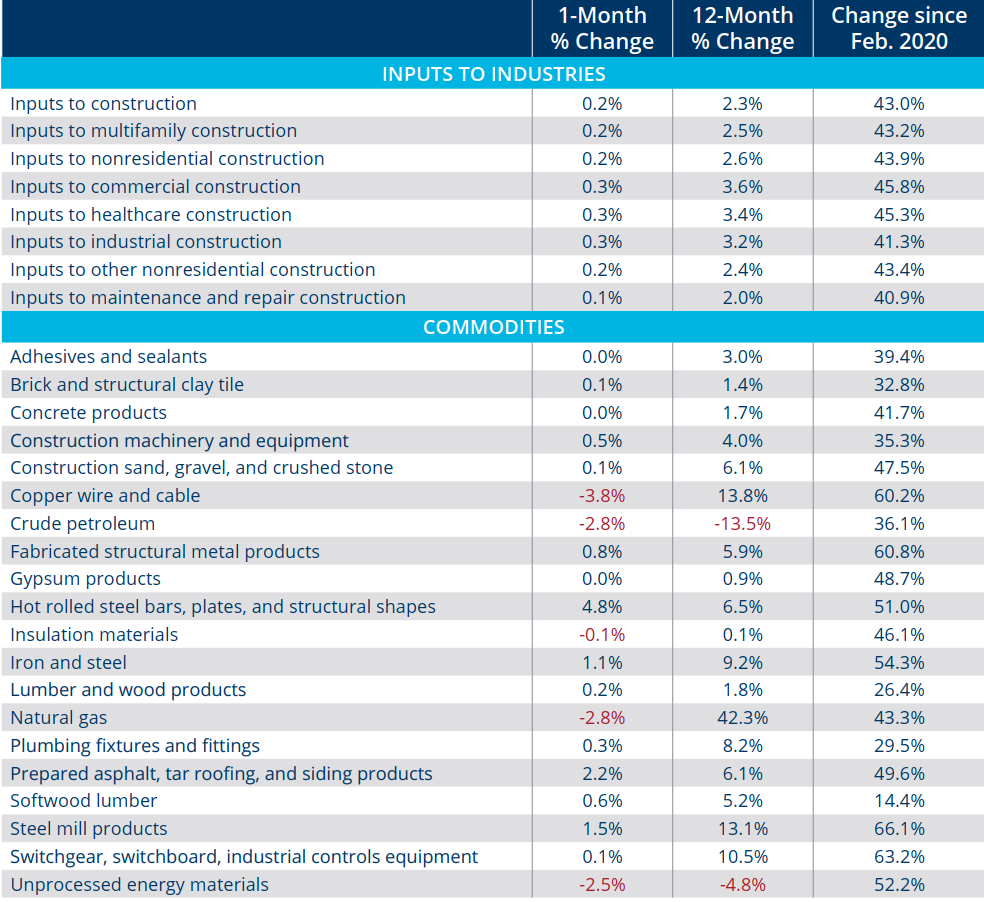
Copper wire and cable prices have increased 13.8% year-over-year. This trend aligns with copper’s long-term pricing trajectory, which has risen steadily over the past 15 years. Copper’s relative scarcity compared to other metals contributes to this upward pressure. As a result, electrical system costs are rising, with copper wire remaining one of the most significant material expenses in the construction industry.
Short-term fluctuations are less relevant than year-over-year changes in construction. The 12-month trend line remains upward across most material categories. For example, natural gas—an input for cement production—has increased by 42.3%, which may affect infrastructure projects such as roads and highways.
Construction optimism is stable. Backlog indicators fell from July 2025, however the August year-over-year change is a 0.3 increase. A sign that this time last year less work was on the books for companies in total.7 Fewer number of companies indicated there would be no change expectation to their profit margins when compared to year over year in August 2024. With a smaller variance anticipating a large profit margin dip.
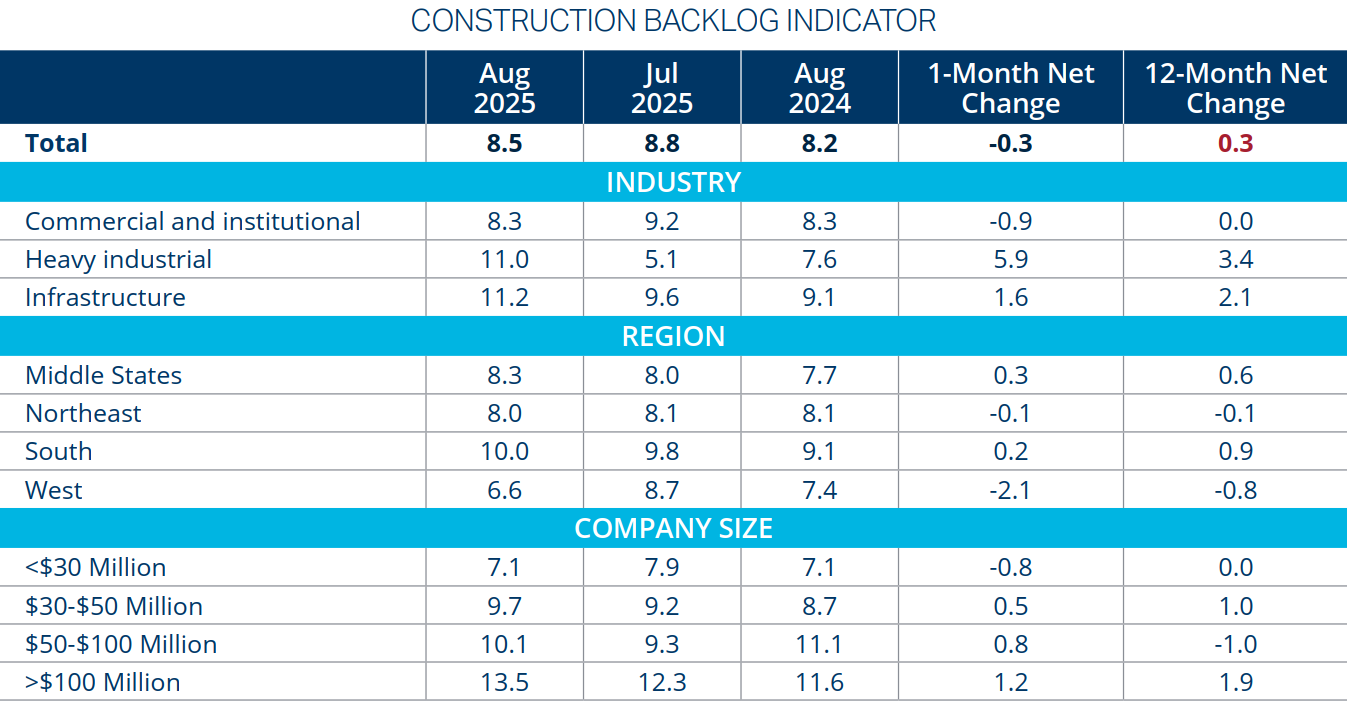
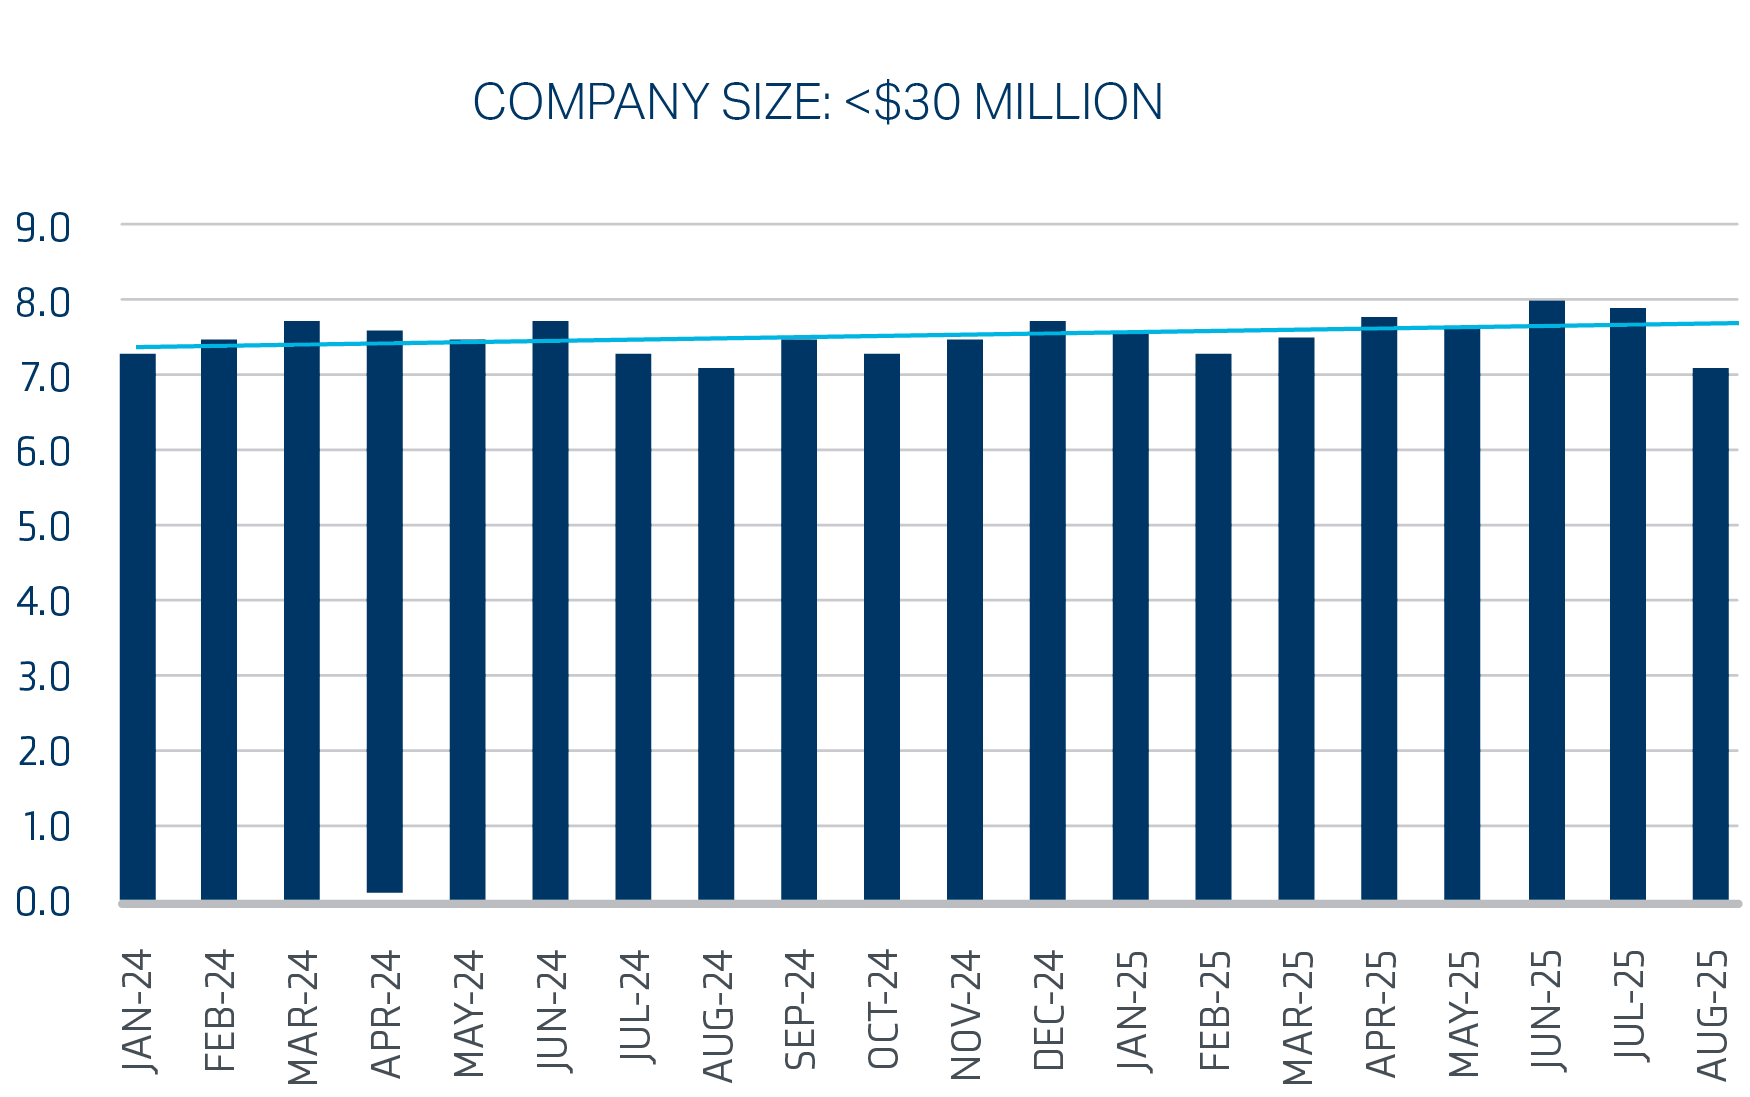
Larger contractors have strong backlog, even with the year-over-year change for those company sizes $50–$100 million. Contractors under $30M over the last 12 months have had the most variation in their backlog when compared to other company sizes.
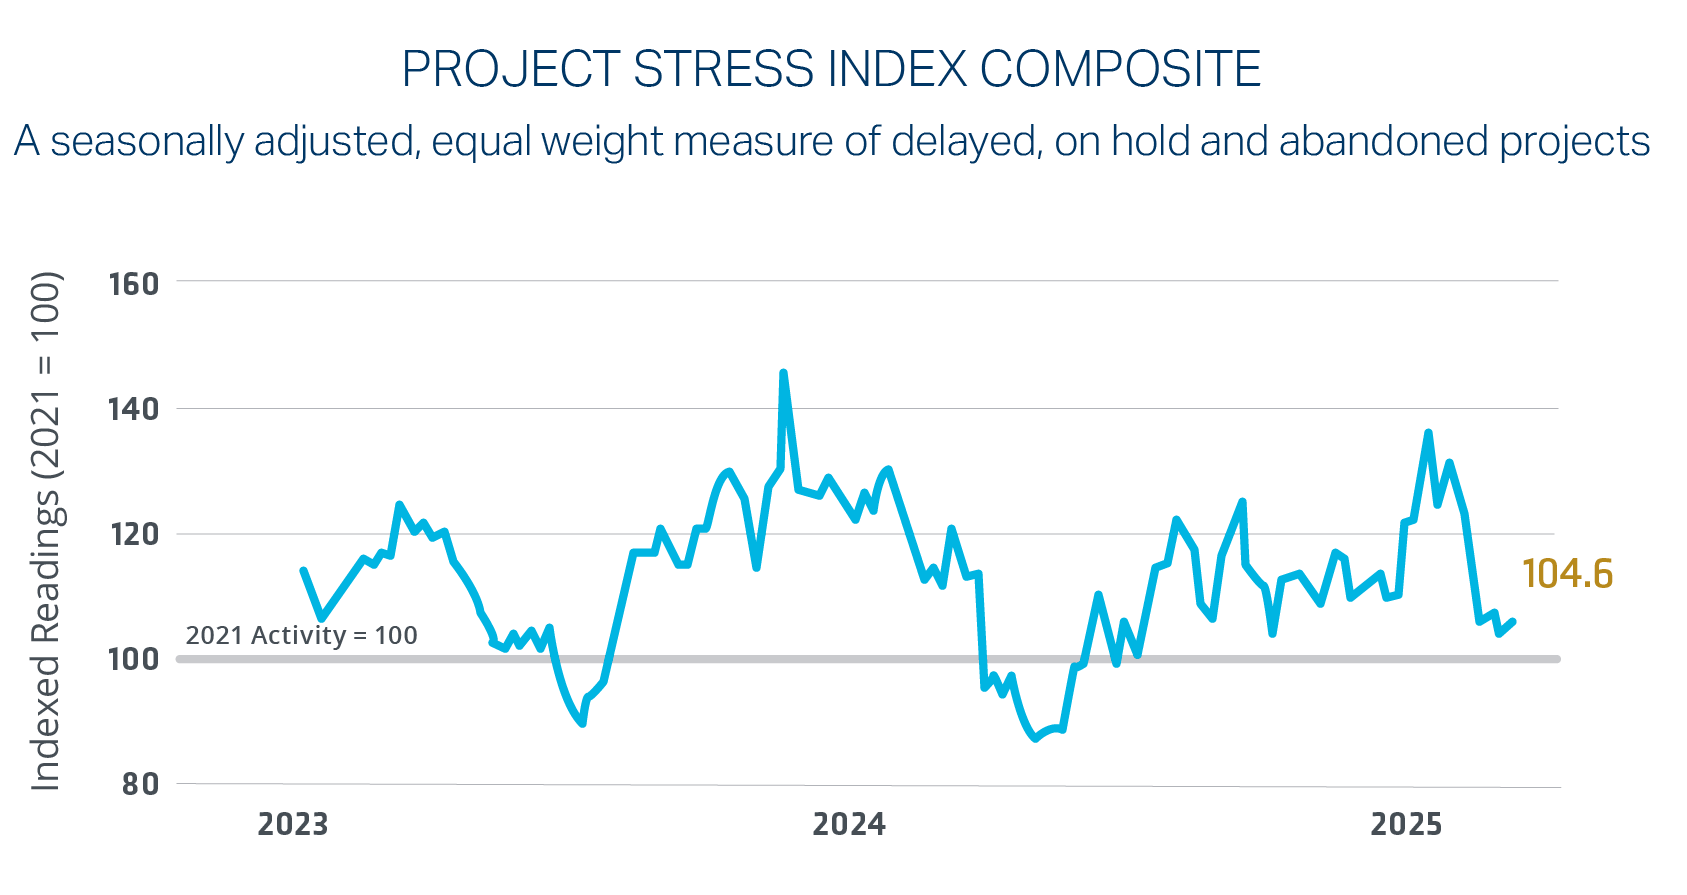
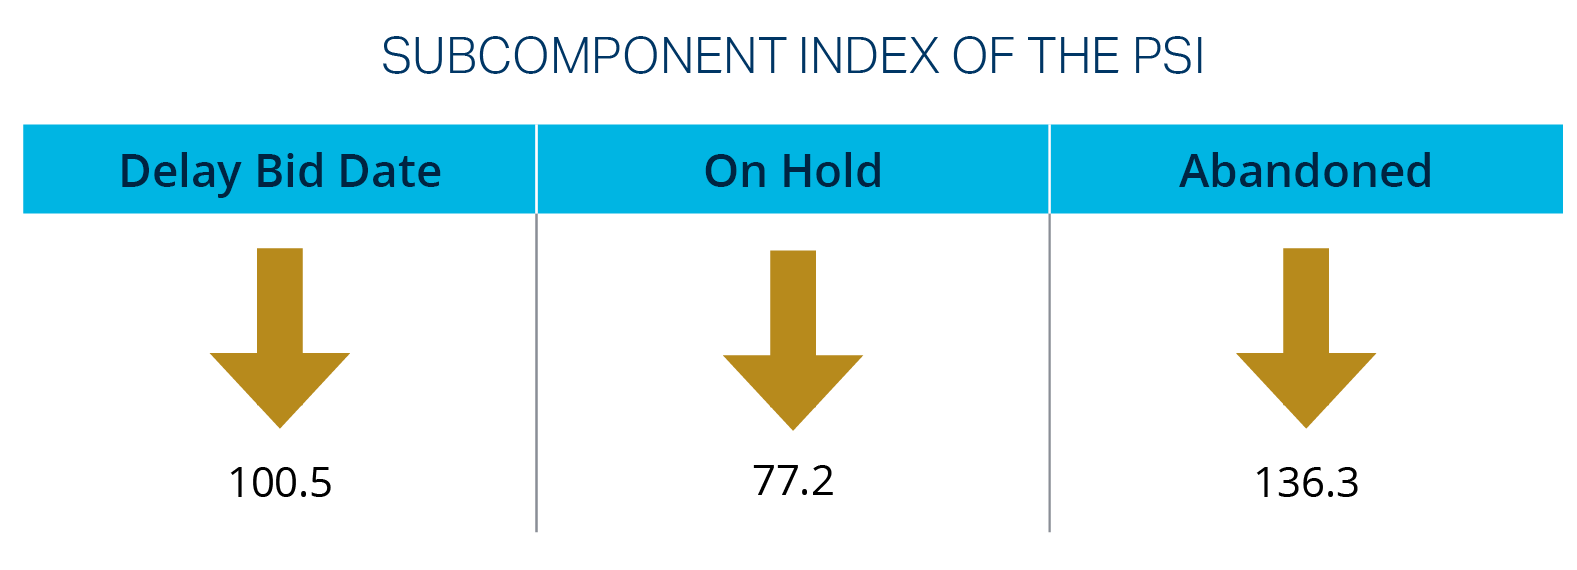
The construction industry experienced heightened stress in May, driven by a 30.3% spike in overall project abandonments, while delayed bids fell 1.9% and on-hold activity remained largely unchanged. Since the end of 2024, abandonment activity has surged 66.5%, compared to modest increases in bid delays (+4.3%) and a notable 18.5% decline in on-hold projects. Private sector abandonments were particularly severe, rising 62.6% month-over-month and 92.2% year-over-year, marking the highest level since ConstructConnect began tracking data in 2019. Private projects placed on hold also climbed 23.1% over the past year, while public projects moved in the opposite direction, with abandonments flat and on-hold activity down 15.2%.
By August, stress indicators began to normalize, with the Project Stress Index (PSI) falling 5.9% month-over-month, led by a 12.2% drop in on-hold activity, while abandonment and bid delays declined 4.9% and 1.7%, respectively. Despite this improvement, the PSI remains 19% higher year-over-year, largely due to an 88.2% increase in abandonment activity compared to historically low levels in 2024. These trends suggest the market is moving away from the elevated stress seen earlier in the year and returning to more typical patterns rather than signaling ongoing deterioration.
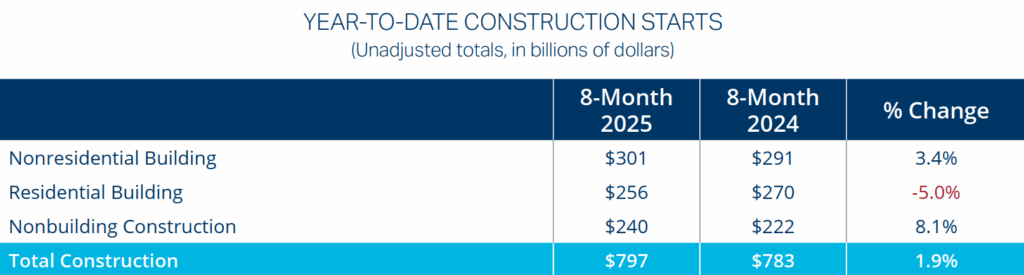
The construction market showed modest growth in August, with total starts rising 1.7% to an annual rate of $1.23 trillion.6 While residential and non-building sectors saw gains, nonresidential building starts declined, reflecting a mixed outlook amid economic uncertainty and reliance on large-scale mega-projects to sustain momentum.
The Architectural Billing Index (ABI), a leading indicator tracked by the American Institute of Architects, reflects whether architectural firms are billing more or less than the previous month, with readings above 50 signaling growth and below 50 indicating contraction. Economic conditions in June were mixed with billing year-over-year almost unchanged. Staffing challenges persist across architecture firms: 64% report being appropriately staffed, while 24% are understaffed and 12% overstaffed.12 Understaffing is most pronounced among smaller firms and those in the South, with median gaps reaching 30% for firms with billings under $1 million. Overstaffing is more common among large firms and those specializing in multifamily residential projects, with median excess staffing at 10%. These dynamics underscore ongoing labor pressures and cost volatility within the industry.
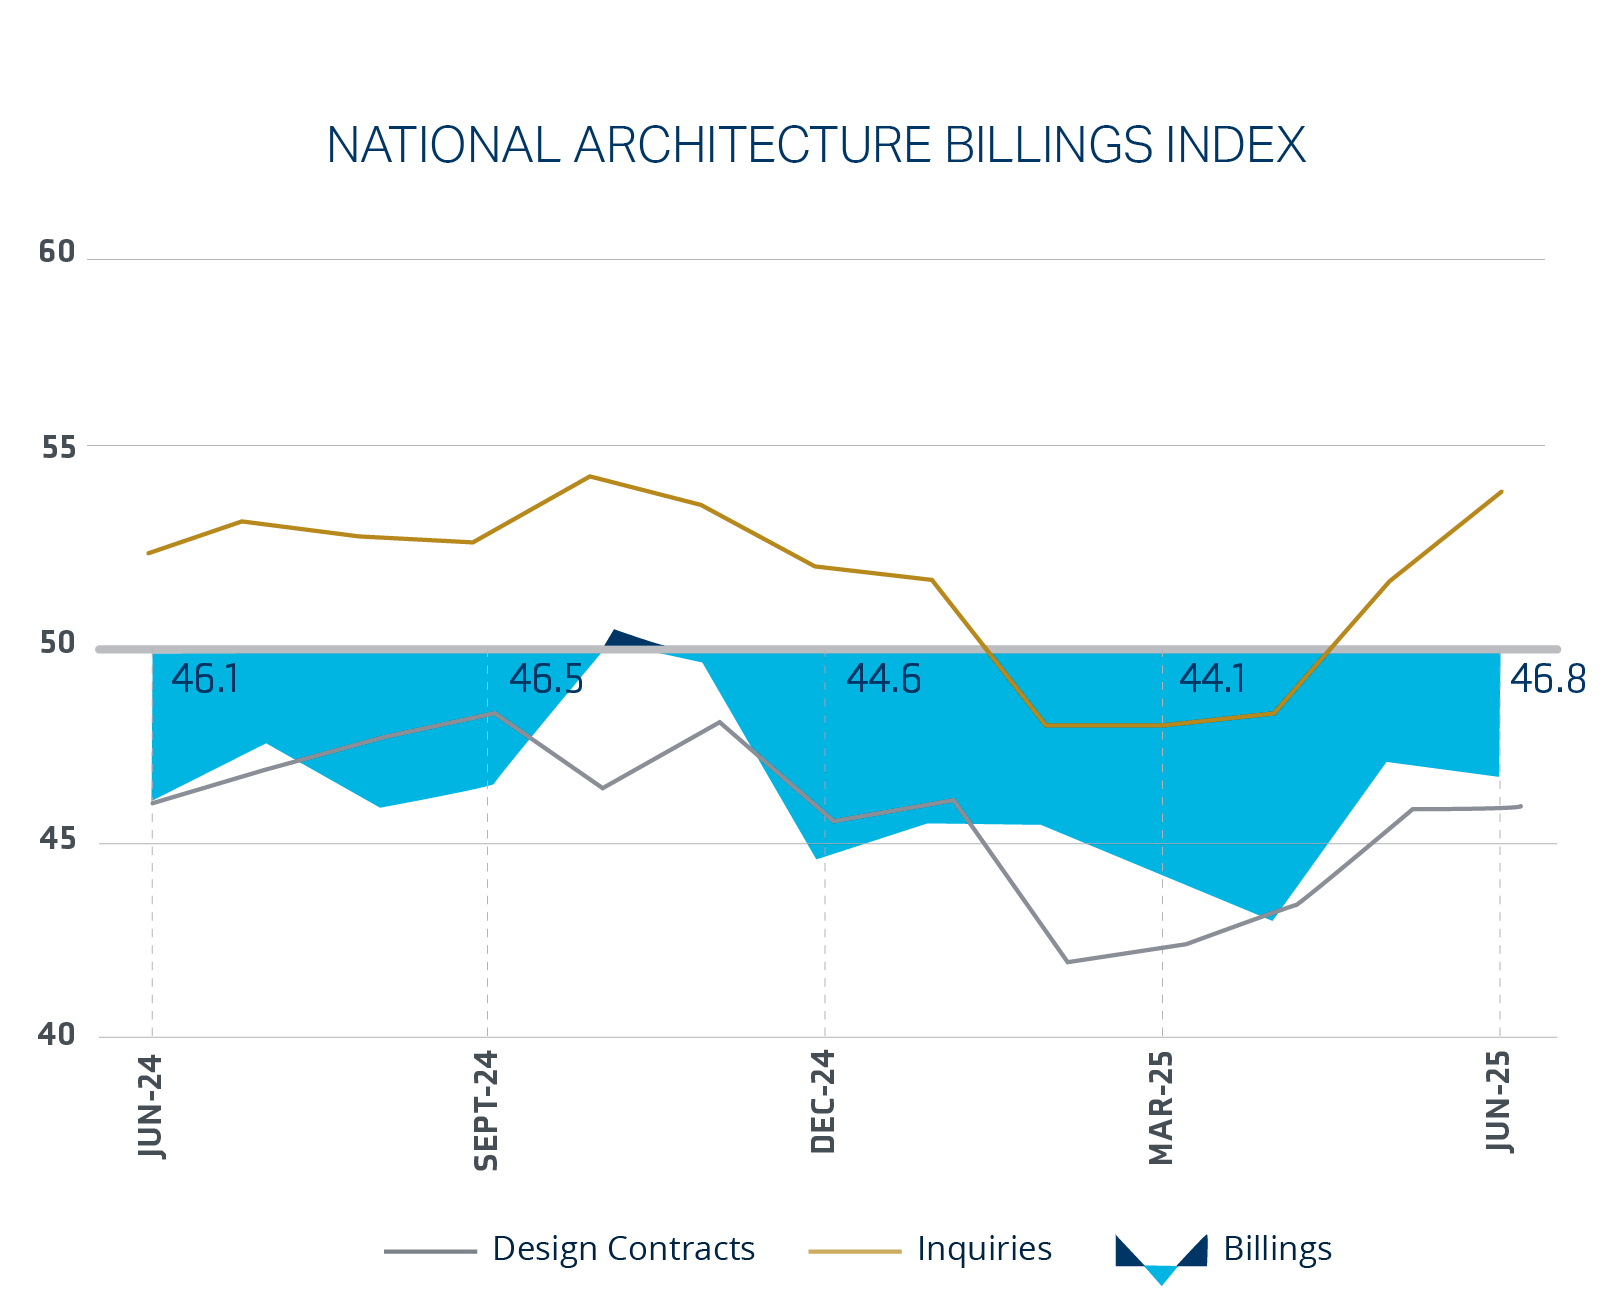
The ABI has hovered around or below 50 for nine consecutive months, signaling a prolonged period of stagnant growth in architectural billings. This trend suggests that architects are producing fewer plans and design concepts, which could slow future construction starts. Since ABI serves as a leading indicator, its trajectory directly influences expectations for upcoming construction activity and spending.
The construction industry is experiencing a period of mixed performance, with notable divergences across residential, nonresidential, and public spending sectors. Residential construction continues to face headwinds, with spending and employment declining steadily. Nonresidential construction, buoyed by data center projects and infrastructure demands, remains a bright spot despite broader economic uncertainty. Public construction spending has shown significant growth over the past three years, driven by government investments in infrastructure, though the recent government shutdown may introduce short-term disruptions.
Material costs, including copper and natural gas, are rising, creating budgetary pressures for contractors, while declining crude petroleum prices offer some relief. Employment trends highlight a tightening labor market, with wage growth outpacing hours worked, particularly in nonresidential sectors. Backlog indicators suggest stability, though smaller contractors face greater variability in workload and profit margins. Stress indicators, including project abandonments and bid delays, are beginning to normalize after a volatile start to the year.
Looking ahead, the construction industry is expected to face continued challenges from rising material costs, labor shortages, and economic uncertainty. Residential construction is likely to remain subdued, with limited growth prospects in the near term. Nonresidential construction, particularly in infrastructure and data centers, is expected to drive activity, supported by strong public spending and large-scale megaprojects. Public construction spending is forecasted to remain robust, with government investments in infrastructure providing stability despite potential political disruptions.
The Architectural Billings Index suggests a prolonged period of stagnant growth in design activity, which may slow future construction starts. However, the industry’s resilience, supported by infrastructure demands and public spending, provides a foundation for cautious optimism. Contractors will need to adapt to rising material costs, shifting labor dynamics, and evolving market conditions to maintain profitability and sustain growth in the coming months.
Matt Chase
Executive Vice President, National Construction Practice Group
Tim Nierman
Senior Vice President, National Construction Practice Group
Angela Thompson
Marketing Strategist, Market Intelligence & Insights
Brian Spinner
Sr. Marketing Coordinator, Market Intelligence & Insights