INSURANCE MARKETS
PREMIUM INCREASES ACCELERATE IN Q1
All major lines of insurance coverage, save for Workers’ Compensation, saw some level of average premium increase during the first quarter of 2018. As has been the case over the recent past, Commercial Auto led the way, clocking a 7.7% average increase in Q1. Commercial property experienced its largest rate increase in the last 3 quarters, 3.4%, as the effect of the 2017 storm season became fully realized.
EFFECT OF
SURPLUS & NON-TRADITIONAL CAPITAL
In aggregate, the insurance marketplace reached a record of $700 billion in surplus – a surplus which has driven carriers to continue to price risk aggressively in order to win to business.
Beyond this massive balance sheet surplus, inflows of capital from non-traditional sources, collateralized reinsurance or Insurance Linked Securities (ILS) have helped further depress pricing. Within non-traditional sources of capital: the Catastrophe Bond market grew to a record-setting $32.83 billion in total market size, representing absolute growth of $1.8 billion since the end of 2017 (one of the worst NatCat years in history). Including Catastrophe Bonds – the total risk issuance of ILS’ reached $4.24 billion in Q12018, the first time total issuances have surpassed $4 billion in the first quarter of the year.
While it appears likely Catastrophe Bond pricing will remain relatively flat due to continued capital inflows into the product; catastrophe losses at Lloyds of London pushed over 80% of syndicates into the red for 2017 – indicating a pricing correction during 2018. At the end of 2017, the median combined ratio for Lloyds syndicates stood at 113% beating even Commercial Auto in traditional markets. The pricing correction based on these losses at Lloyds will affect insureds in catastrophe prone areas the most, yet do not expect a significant increase in reinsurance costs as many losses during the 2017 storm season were contained in policies’ primary layers.

Overall carrier surpluses and the influx of non-traditional capital into the insurance market has had a steadying effect on insurance pricing. Considering the magnitude of the surplus, and the forecasted increase in ILS offerings, it can be reasonably expected that the projected ascent of insurance pricing will be blunted by both of these factors.
PRICING UPDATE
MAJORITY OF RATES SEE SLIGHT INCREASE
The five major lines of coverage saw an average rise of 2.2% in Q1 2018. This upward trend was driven primarily by commercial auto (7.7%) and commercial property (3.4%) and blunted by the continued softening of workers’ comp, which registered a 2% average decline during the first quarter.


UNDERWRITING DEMAND
PERCENT OF RESPONDENTS NOTING AS INCREASE IN DEMAND
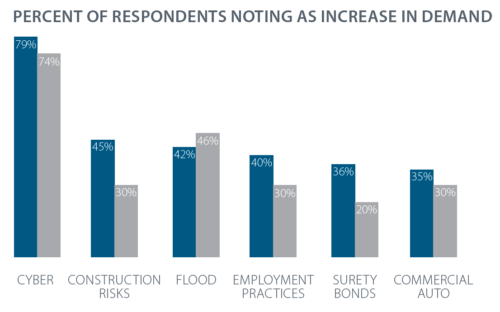 Carrier appetite for cyber coverage continued to increase during Q1, even in the face of warnings from some industry experts that the increase in availability over the last few years has been driven by ‘naïve capacity’, underwriters and carriers who do not have adequate loss histories to properly price this emerging risk.
Commercial property underwriting capacity constricted in the first quarter as some specialty carriers exited markets in the US Southeast and Gulf Coast, and as Lloyds syndicates began to reconsider what risks could be profitably written after the disastrous 2017 storm season.
Between 2011 and 2016, commercial auto underwriting losses grew from $744.8 million to $2.9 billion, leading many carriers to restrict their exposure or exit writing this line of coverage all together.
UNDERWRITING DEMAND
PERCENT OF RESPONDENTS NOTING AS INCREASE IN DEMAND
The five major lines of coverage saw an average rise of 2.2% in Q1 2018. This upward trend was driven primarily by commercial auto (7.7%) and commercial property (3.4%) and blunted by the continued softening of workers’ comp, which registered a 2% average decline during the first quarter.
COMMERCIAL AUTO
Commercial auto loss ratios have topped 100% every year since 2011, meaning underwriters have yet to find a profitable formula with which to insure. Though down from a peak of 112% in 2016, combined ratios continue to hover around 110%, meaning the market can continue to expect rate increases in commercial auto moving forward.

Citations
Artemis Q1 2018 Catastrophe Bond & ILS Market Report (http://www.artemis.bm/artemis_ils_market_reports/downloads/q1-2018-cat-bond-ils-market-report.pdf?utm_ source=Article&utm_medium=Link&utm_content=Q12018Report&utm_campaign=Q12018Report)
CIAB Q1 2018 Property / Casualty Market Index (https://www.ciab.com/download/14403/)
The Insurance Insider